Key takeaways
- A customer journey map template is a grid of 5–7 journey stages and 8 lanes for one persona and one scenario.
- Fill it from user research: 10–15 interviews per user group for quotes and expectations, contextual inquiry with 4–6 users for actions and touchpoints.
- Mark every cell heard, observed, measured or assumed, so a hypothesis map never passes as research.
- A journey map drives decisions only when each opportunity has one owner, one metric and a date.
- Our template is free to download in PDF, SVG, PNG and CSV, with an illustrative worked example.
Our customer journey map template has an empty cell under Stage 2, Thinking, and what you write there decides whether the map is evidence or fiction. Written in a workshop, the cell says "Users find setup confusing." Written after research, it says "'Where do I say Sarah only works Tuesdays?' Heard in 9 of 12 interviews, seen in 4 of 5 site visits" (an illustrative example).
Only the research version tells a product team who said it, how often and where to look, and that is what makes a cell worth acting on. Journey mapping sits inside user experience (UX) research, the discipline behind our UX research services; below you get the template, a worked example and 7 steps to fill every lane from user research.
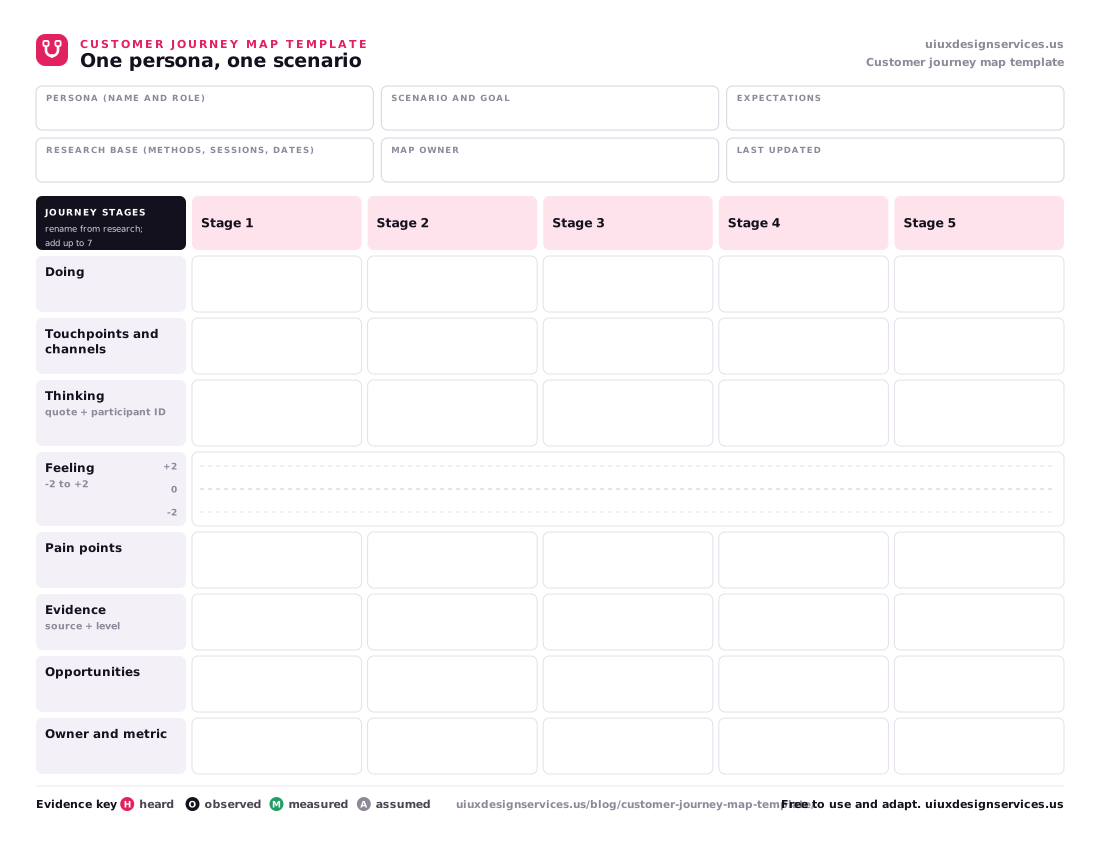
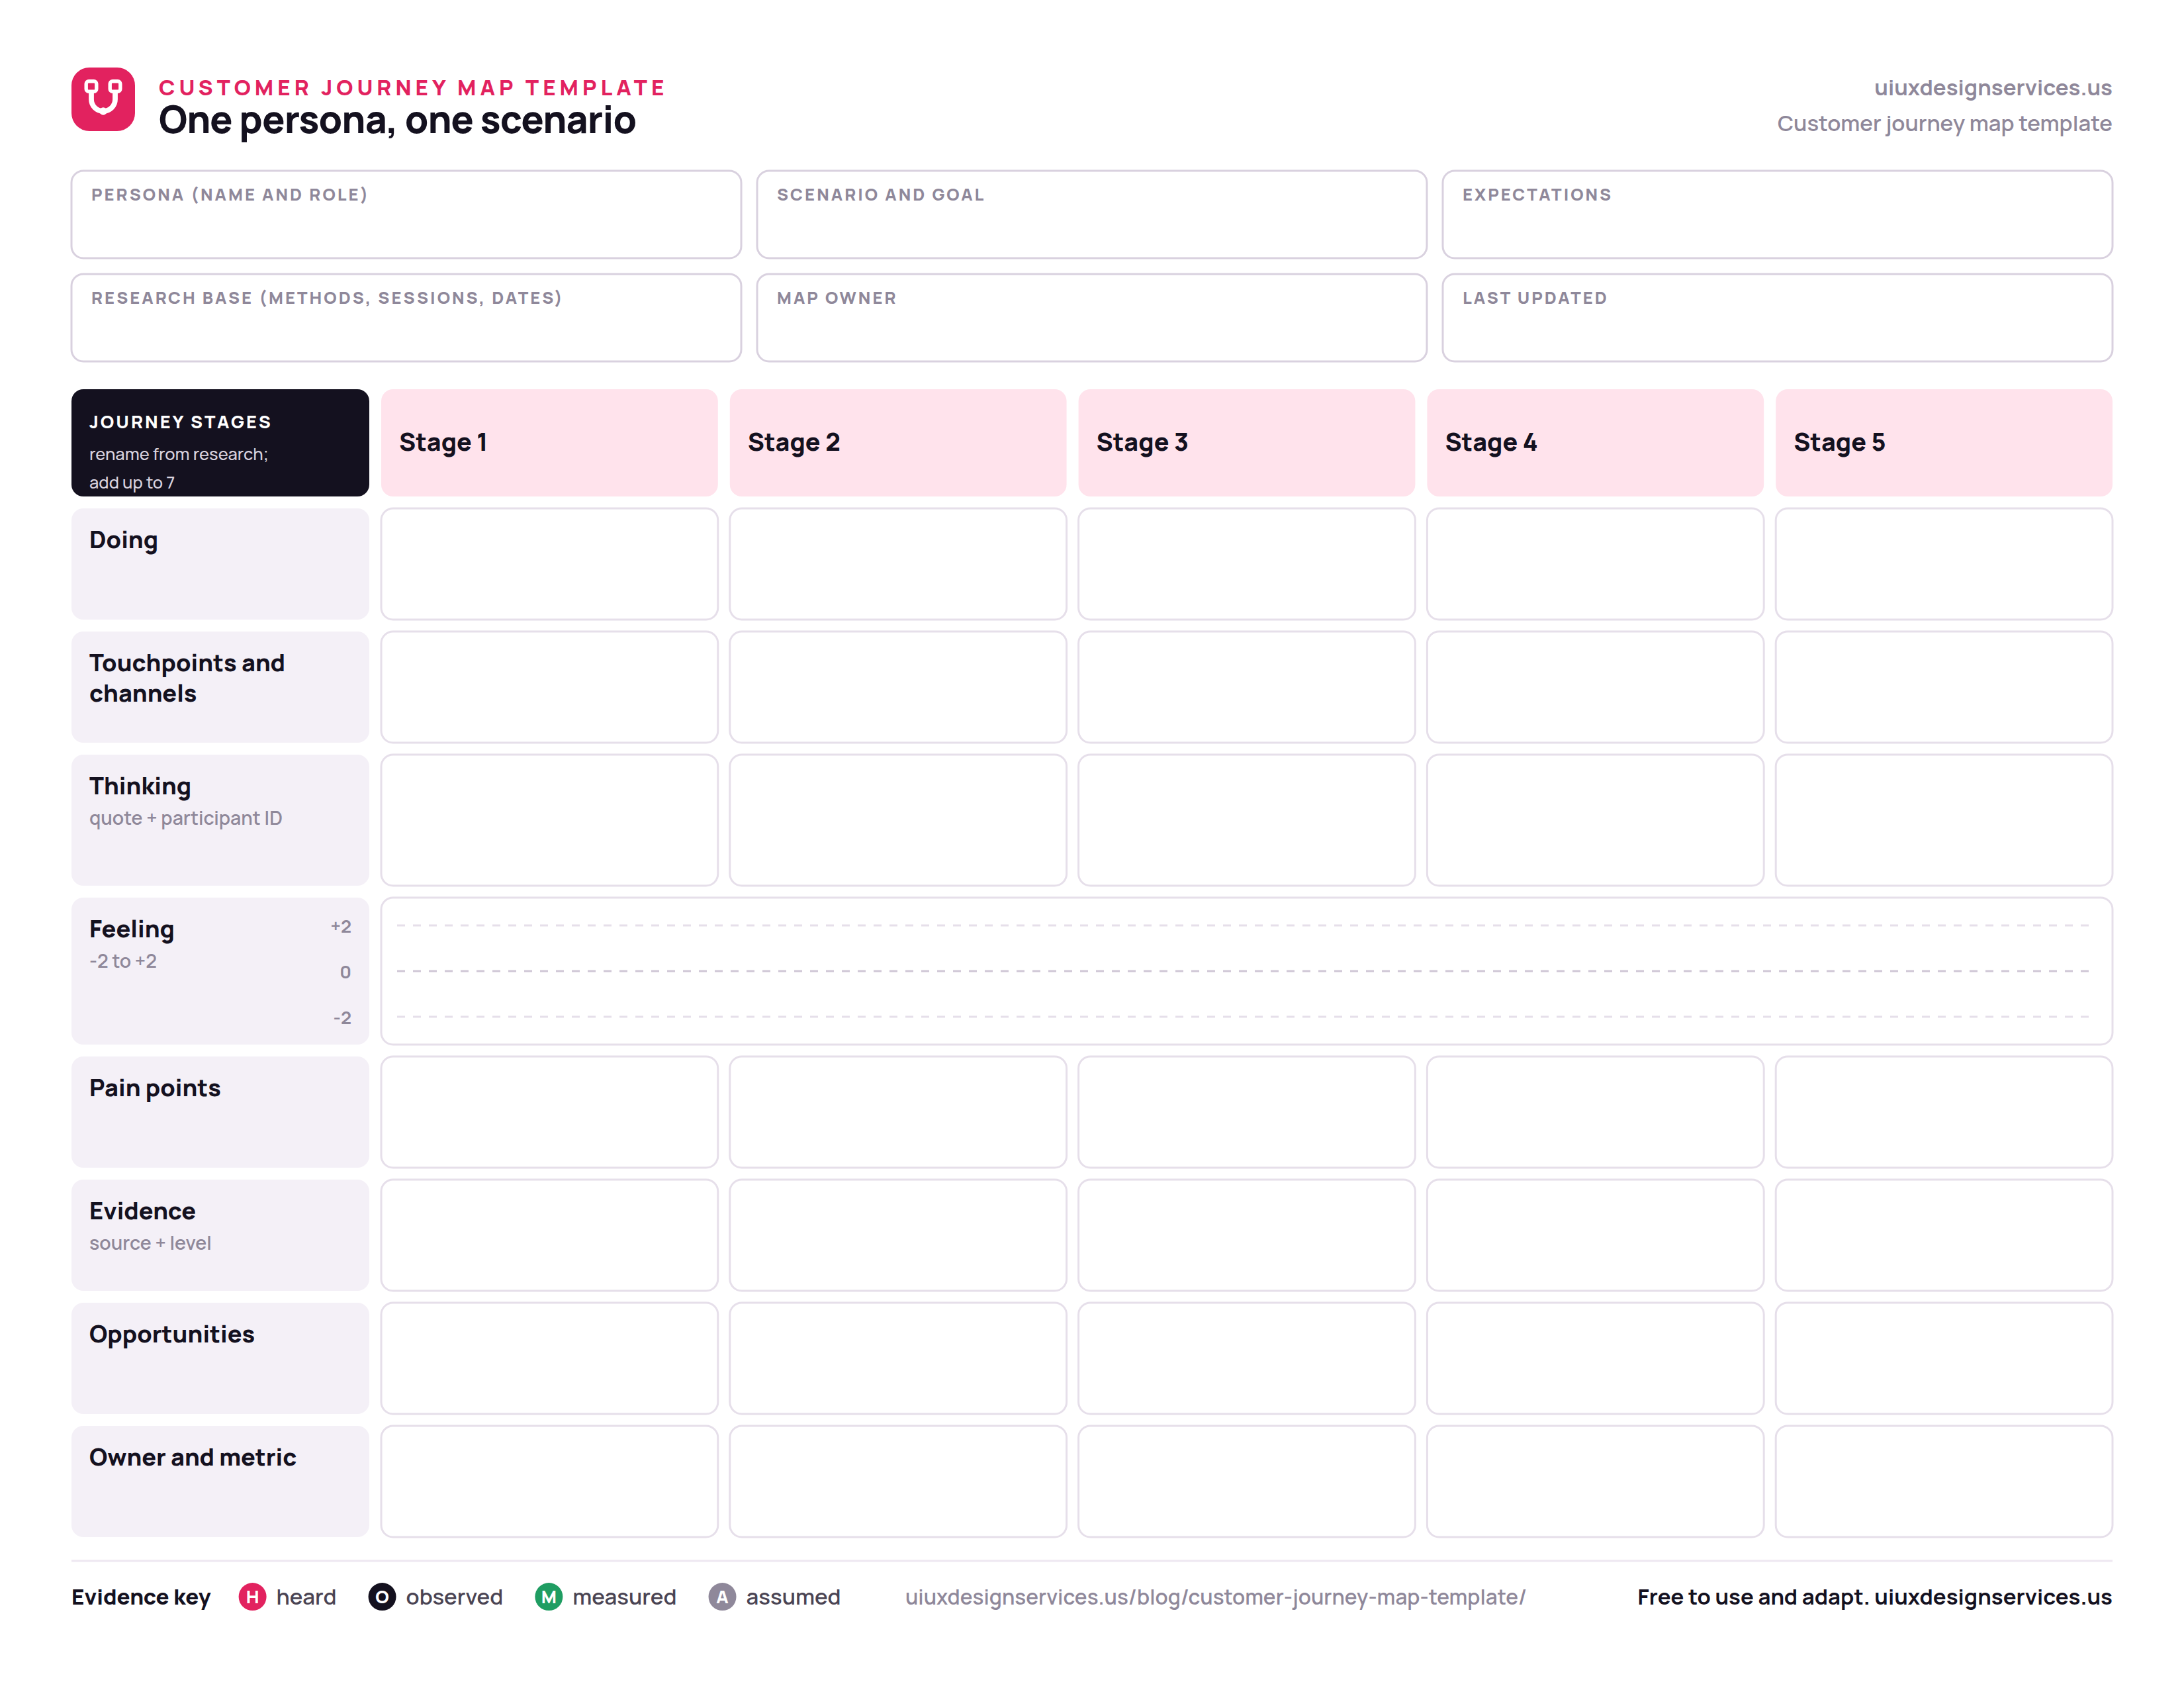
Download the customer journey map template below in four file formats, with no form to fill. Each blank template file has the same 6 header fields, 5 stage columns and 8 lanes. Free to use and adapt.
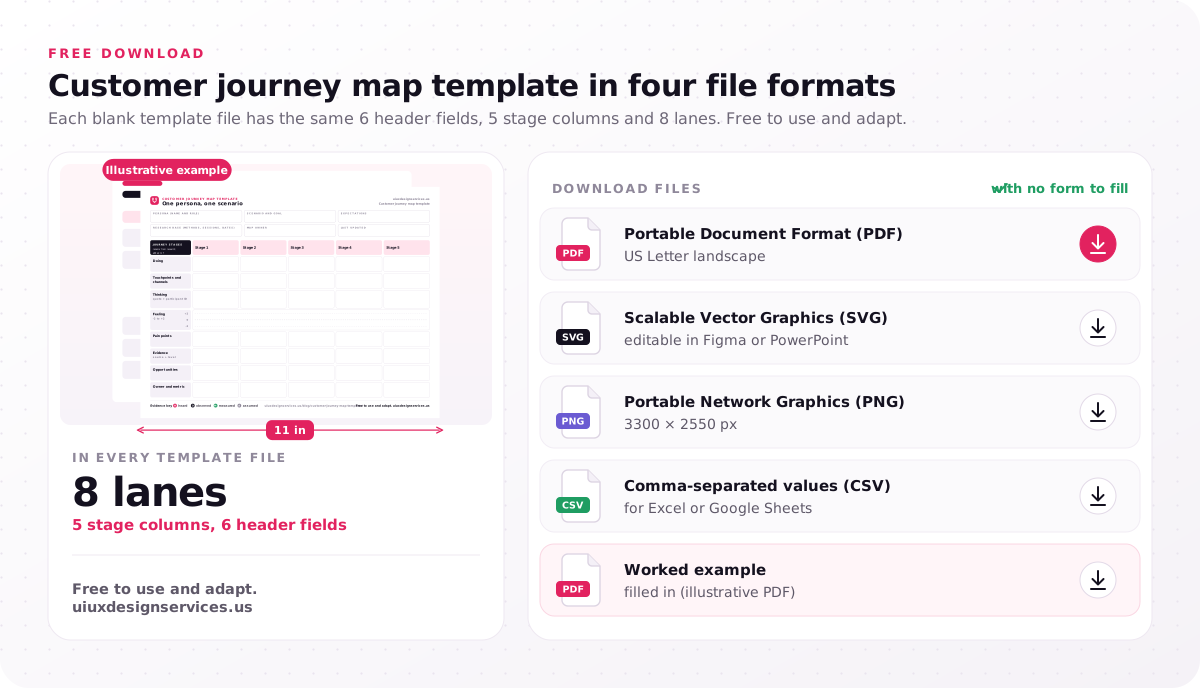
- Portable Document Format (PDF), US Letter landscape
- Scalable Vector Graphics (SVG), editable in Figma or PowerPoint
- Portable Network Graphics (PNG), 3300 × 2550 px
- Comma-separated values (CSV), for Excel or Google Sheets
- Worked example, filled in (illustrative PDF)
What is a customer journey map template, and what's in ours?
A customer journey map template is a reusable grid that a team fills with user research to show how one persona moves through one scenario, stage by stage.
Nielsen Norman Group (NN/g) describes a journey map as a picture of the process a person goes through to accomplish a goal. The template is that picture before anyone draws on it: a persona and scenario header, journey stages across the top, and lanes down the side for actions, touchpoints, thoughts, emotions, pain points, evidence, opportunities and owners. Ours has 6 header fields, 5 editable stage columns and a lane count of 8. Its file formats are PDF, SVG, PNG and CSV, and the Feeling lane uses an emotion scale from -2 to +2.
The table lists each part of the template and what goes in it.
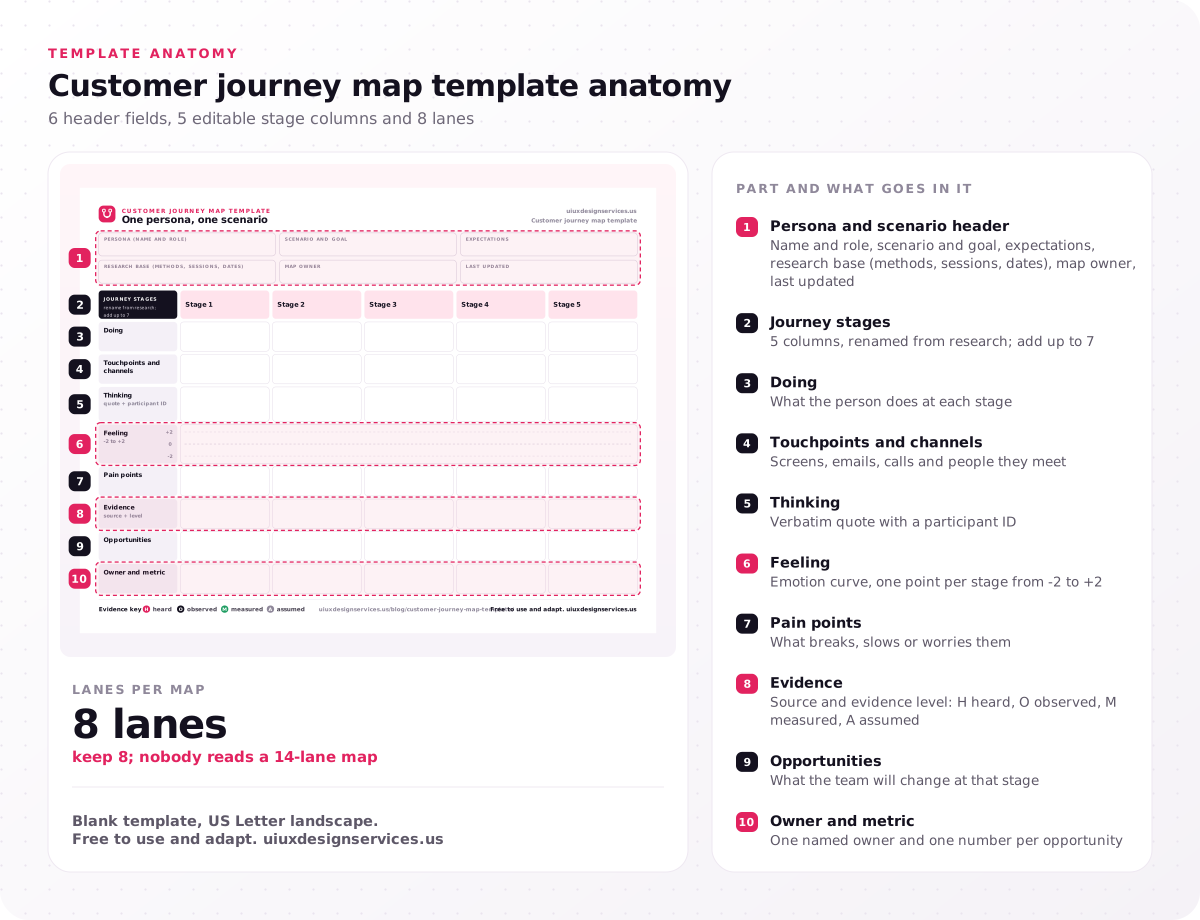
| Part | What goes in it |
|---|---|
| Persona and scenario header | Name and role, scenario and goal, expectations, research base (methods, sessions, dates), map owner, last updated |
| Journey stages | 5 columns, renamed from research; add up to 7 |
| Doing | What the person does at each stage |
| Touchpoints and channels | Screens, emails, calls and people they meet |
| Thinking | Verbatim quote with a participant ID |
| Feeling | Emotion curve, one point per stage from -2 to +2 |
| Pain points | What breaks, slows or worries them |
| Evidence | Source and evidence level: H heard, O observed, M measured, A assumed |
| Opportunities | What the team will change at that stage |
| Owner and metric | One named owner and one number per opportunity |
Tool templates differ mainly in where they live: Miro and FigJam boards need an account, Confluence offers a wiki page template, HubSpot's templates sit behind a download form and Canva offers visual layouts. Ours needs no account or form: place the PNG or PDF on a Miro or FigJam board, edit the SVG in Figma or PowerPoint, or open the CSV in a spreadsheet. Whichever you pick, fill the header before any stage.
What is customer journey mapping?
Customer journey mapping is the process of researching and drawing the stages one type of customer goes through, with their actions, thoughts and emotions and the opportunities those reveal.
A journey map template is only the grid; the research fills it. A customer journey mapping template is the same grid under another name, so download whichever format your team edits fastest.
How does a customer journey map differ from other UX maps?
A customer journey map follows one persona across a whole relationship with a company; a user journey map follows the same person through one product task, both from user research.
A user journey map uses the same grid, scoped to one product task instead of the whole customer relationship. Product teams often call the product-scoped version a UX journey map, and the same file works as a user journey map template: rename the stages to the steps of one task.
NN/g's UX mapping cheat sheet separates the other maps by point of view, scope and time order. The table compares six maps on those points and the question each answers.
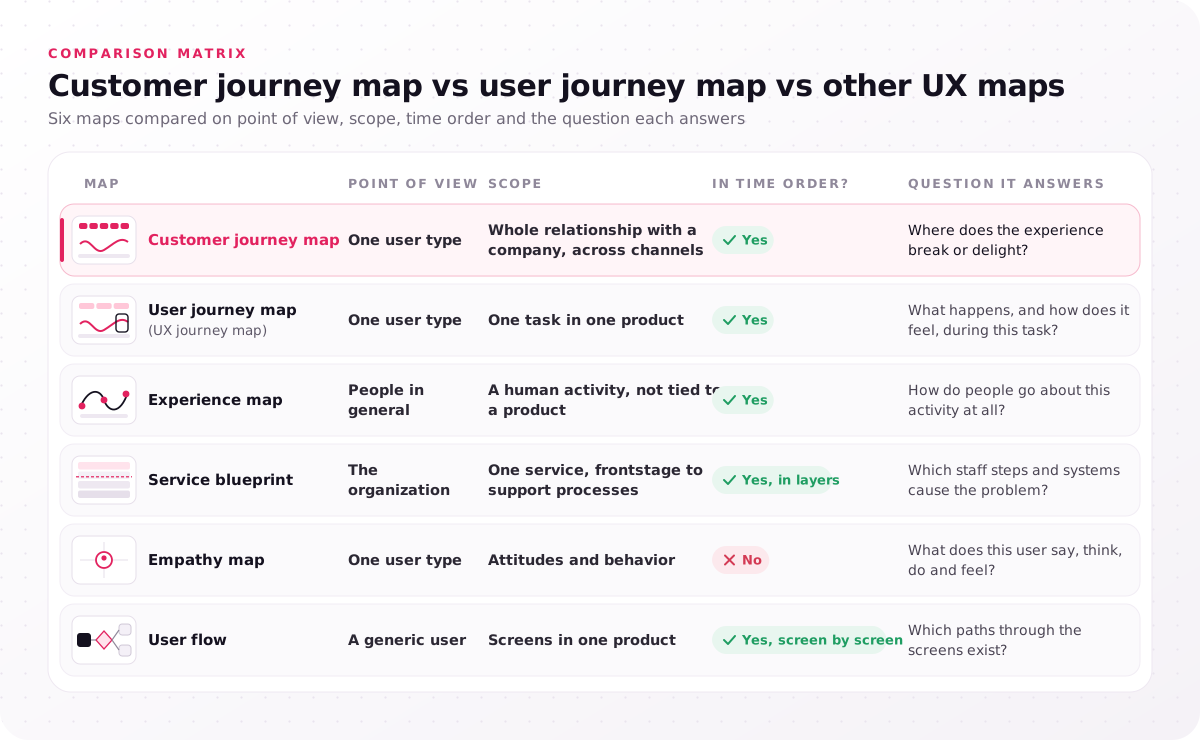
| Map | Point of view | Scope | In time order? | Question it answers |
|---|---|---|---|---|
| Customer journey map | One user type | Whole relationship with a company, across channels | Yes | Where does the experience break or delight? |
| User journey map (UX journey map) | One user type | One task in one product | Yes | What happens, and how does it feel, during this task? |
| Experience map | People in general | A human activity, not tied to a product | Yes | How do people go about this activity at all? |
| Service blueprint | The organization | One service, frontstage to support processes | Yes, in layers | Which staff steps and systems cause the problem? |
| Empathy map | One user type | Attitudes and behavior | No | What does this user say, think, do and feel? |
| User flow | A generic user | Screens in one product | Yes, screen by screen | Which paths through the screens exist? |
A service blueprint adds the frontstage and backstage actions of staff plus their support processes, so draw one after a journey map shows where the problem sits. An empathy map skips time order, and an experience map covers people in general rather than one product, which is why NN/g places it before a customer journey map.
What is a user journey?
A user journey is the sequence of steps a person takes in a product to reach one goal, such as booking a first appointment.
A map of that journey adds what they think and feel at each step, plus what happens outside the product, like a call to support. Write the goal in the header's scenario field first.
How does a user journey map differ from a user flow?
A user flow is a screen-by-screen diagram of the paths any user can take, while a user journey map shows one research-based persona's experience, with emotions and off-screen steps.
Teams settle the user journey map vs user flow question by order of work: map the journey first to find which moment to fix, then draw a user flow for that moment's screens.
Which stages and lanes belong in a journey map template?
A journey map template should hold the 5–7 journey stages your user research finds and 8 lanes, so each column shows where one persona actually struggles.
We set the stage count at 5–7 per map, because fewer hides the hard moments and more turns the grid into a user flow. Keep the map scope to one user type and one scenario, as NN/g advises one point of view per map. Our research program sets the persona count at 2–4, each built from user interviews rather than invented in a workshop like a marketing buyer persona.
What are the 7 steps of the customer journey?
No single standard defines a 7-step customer journey; one published 7-stage set is awareness, consideration, decision, purchase, use, loyalty and advocacy.
That set suits a lifecycle customer journey map for a whole brand or product lifecycle; for a software-as-a-service (SaaS) product, the lifecycle journey mapping step of our SaaS UX design process covers the in-product part of a lifecycle, every stage from sign-up to renewal. For product work, stages named from interviews beat it: "Consideration" tells a designer nothing about which screen to change, while "Set shift rules" does.
Current-state, future-state and day-in-the-life maps
A current-state map shows today's journey, a future-state map shows the journey you plan to build, and a day-in-the-life map covers one person's whole working day.
The download is a current-state map by default; a future-state map reuses the grid after research, and a day-in-the-life map suits shift work, where your product's user interface (UI) is one screen among many, such as the picker and dispatcher shifts our researchers shadow for supply chain UI UX design. A circular map draws the stages as a loop, for journeys that repeat, such as a monthly subscription renewal.
What each lane needs
A customer journey map template only saves time if every cell can point to a source:
- Persona and scenario header: the research base line (methods, sessions, dates) lets readers judge the map first.
- Journey stages: named after what participants did, in their order.
- Touchpoints: every screen, email, call and person, since problems often sit between channels.
- Emotion curve: its sharpest highs and lows flag likely moments of truth, where the user forms a lasting opinion and decides to stay or leave; the highs are moments of delight, but check the lowest point first.
- Evidence lane: source and evidence level for every cell, so guesses stay visible.
- Opportunities and owners: one internal owner and one metric each, or nobody acts on them.
The Thinking lane holds thoughts and mindsets as verbatim quotes, never a team summary. Rename the stage columns from your own notes before you write a single cell.
Where does evidence for each journey map lane come from?
Each journey map lane needs its own kind of user research: interviews fill Thinking, contextual inquiry fills Doing and Touchpoints, and analytics and support tickets count pain points.
Kate Kaplan's NN/g guide on when and how to create customer journey maps treats journey mapping as a qualitative-research process and notes that quantitative data alone cannot build the story. Numbers back up a map; they never write it.
Our research program plans an interview count of 10–15 one-hour user interviews per user group. Contextual inquiry means watching people do real work where they do it and asking about it as they go; we set the observation count at 4–6 users, on site, for example at a clinic front desk. Our guide on how to run a contextual inquiry covers the method itself.
The table maps each research source to the lanes it fills and its blind spot; for sample sizes and outputs across 12 studies, see how UX research methods compare on sample size and output.
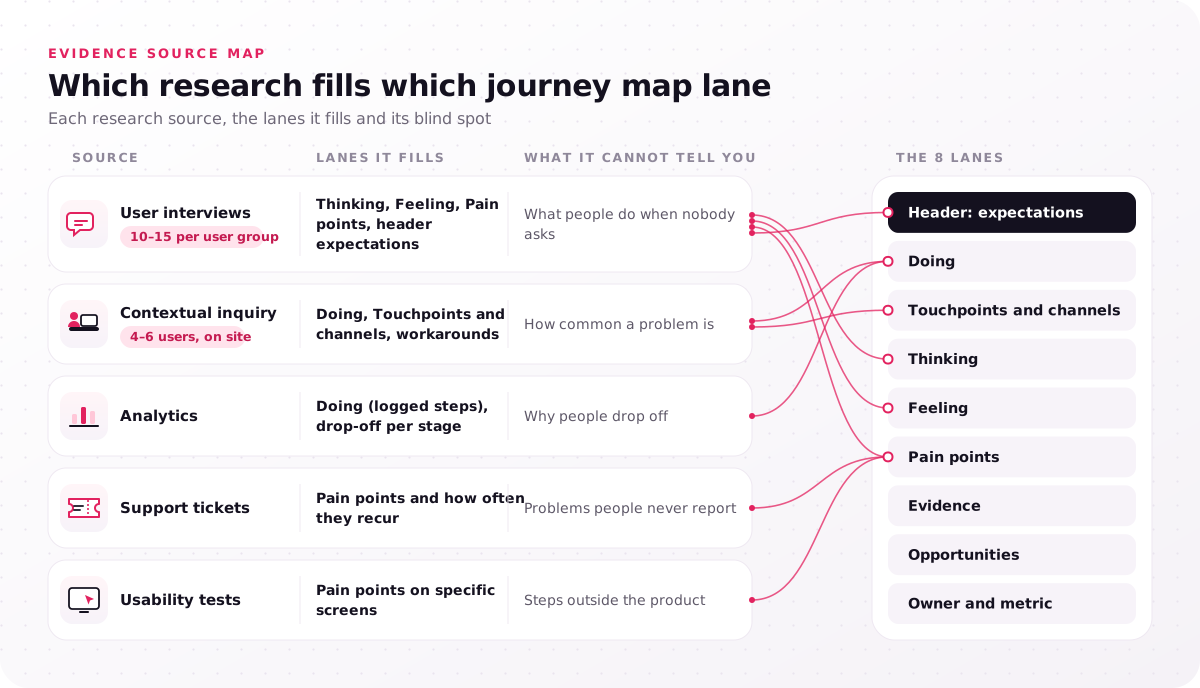
| Source | Lanes it fills | What it cannot tell you |
|---|---|---|
| User interviews (10–15 per user group) | Thinking, Feeling, Pain points, header expectations | What people do when nobody asks |
| Contextual inquiry (4–6 users, on site) | Doing, Touchpoints and channels, workarounds | How common a problem is |
| Analytics | Doing (logged steps), drop-off per stage | Why people drop off |
| Support tickets | Pain points and how often they recur | Problems people never report |
| Usability tests | Pain points on specific screens | Steps outside the product |
The evidence lane gives every cell an evidence level from a four-letter key:
- H, heard: said in interviews, with a count such as "9 of 12".
- O, observed: seen during site visits or session recordings.
- M, measured: counted in analytics or support tickets.
- A, assumed: team knowledge nobody has checked yet.
The intro's workshop cell is an A; its research cell is an H and an O. NN/g calls a map built from what a team already knows a hypothesis map, and the hypothesis map vs research map distinction matters: the first plans a study, the second is the deliverable. Session recordings show only the screen, so observed cells about the work around it need site visits; our researchers run those 4–6 sessions in our program's generative fieldwork step (7–15 days). Mark every cell on your map before you book interviews.
How do you fill a customer journey map template in 7 steps?
Fill a customer journey map template in 7 steps, from fixing one persona and scenario through interviews, contextual inquiry and synthesis to a validated map with owners.
These steps answer how to create a customer journey map and how to create a user journey map alike; only the scope in step 1 changes.
- Frame the scope. One user type, one scenario, 3–5 research questions. Output: a scope sheet.
- Gather what you have. Pull analytics, support tickets and past studies, then draft a hypothesis map. Output: mostly A cells.
- Run user interviews. 10–15 one-hour sessions per user group about the last time they did the task. Output: verbatim quotes.
- Observe with contextual inquiry. Watch 4–6 users do the task where they work. Output: observation notes and workarounds.
- Tag and cluster. Tag notes in Dovetail, then use affinity mapping, which groups related findings into clusters, to sort them by stage. Output: clusters per stage.
- Write each lane. Name stages from the clusters, quote verbatims, plot the emotion curve and mark evidence levels. Output: a sourced map.
- Validate and assign. Walk 2–3 participants or frontline staff through it, validate and refine, then give each opportunity an owner and a metric. Output: a validated map.
In our program, the interviews and contextual inquiry of steps 3 and 4 run in the generative fieldwork step of our 5-step UX research process, and the map comes out of its synthesis and readout step (4–7 days), inside a research timeline of 4–8 weeks. Start with step 2 this week, because a hypothesis map shows which interviews to book.
Customer journey map template, filled in (illustrative)
This customer journey map example is illustrative: a user journey map of one practice manager's first month with a clinic scheduling app, built from invented user research.
It doubles as an example of a user journey map, since it follows one product task; the clinic, the app, the people and every number are made up. Dana manages a 3-site physiotherapy clinic, the scenario is first-time setup, and the research base reads 12 interviews with practice managers and 5 contextual inquiry visits to front desks.
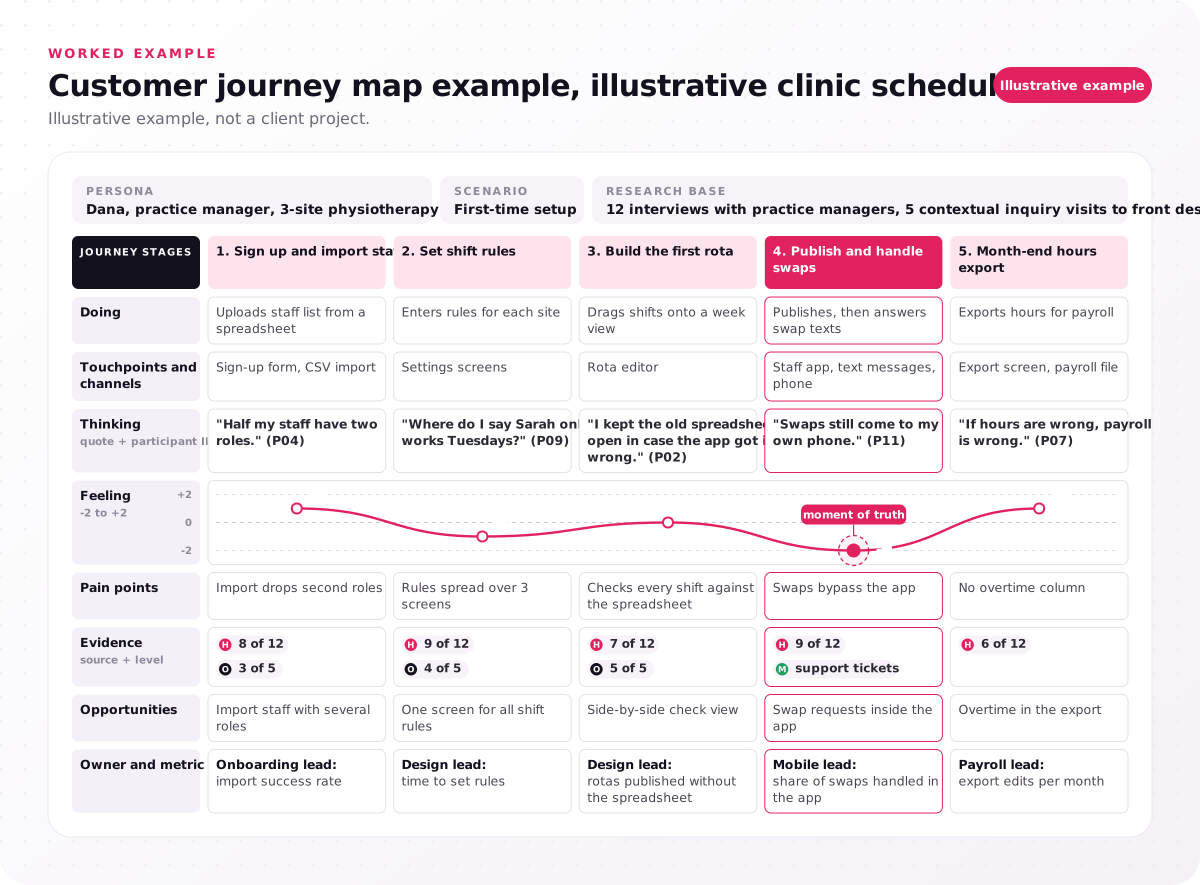
Illustrative example, not a client project.
| Lane | 1. Sign up and import staff | 2. Set shift rules | 3. Build the first rota | 4. Publish and handle swaps | 5. Month-end hours export |
|---|---|---|---|---|---|
| Doing | Uploads staff list from a spreadsheet | Enters rules for each site | Drags shifts onto a week view | Publishes, then answers swap texts | Exports hours for payroll |
| Touchpoints and channels | Sign-up form, CSV import | Settings screens | Rota editor | Staff app, text messages, phone | Export screen, payroll file |
| Thinking | "Half my staff have two roles." (P04) | "Where do I say Sarah only works Tuesdays?" (P09) | "I kept the old spreadsheet open in case the app got it wrong." (P02) | "Swaps still come to my own phone." (P11) | "If hours are wrong, payroll is wrong." (P07) |
| Feeling (-2 to +2) | +1 | -1 | 0 | -2 | +1 |
| Pain points | Import drops second roles | Rules spread over 3 screens | Checks every shift against the spreadsheet | Swaps bypass the app | No overtime column |
| Evidence | H 8 of 12, O 3 of 5 | H 9 of 12, O 4 of 5 | H 7 of 12, O 5 of 5 | H 9 of 12, M support tickets | H 6 of 12 |
| Opportunities | Import staff with several roles | One screen for all shift rules | Side-by-side check view | Swap requests inside the app | Overtime in the export |
| Owner and metric | Onboarding lead: import success rate | Design lead: time to set rules | Design lead: rotas published without the spreadsheet | Mobile lead: share of swaps handled in the app | Payroll lead: export edits per month |
Read the Evidence row first: every opportunity rests on H, O or M evidence, none on an A. The emotion curve bottoms out at stage 4, so swaps are Dana's likely moment of truth. Print the filled example PDF beside your blank copy and compare your lanes row by row.
How do you turn a journey map into decisions, not wall art?
A journey map drives decisions when every opportunity carries one owner, one metric and a date, and the team ranks opportunities by emotion low point and user research evidence.
Our ranking rule weighs how far the emotion curve drops against the evidence level: observed and measured outrank heard, and heard outranks assumed. The table ranks the worked example's top three opportunities with their internal ownership and metric.
| Rank | Opportunity (stage, feeling, evidence) | Owner | Metric |
|---|---|---|---|
| 1 | Swap requests inside the app (4, -2, H and M) | Mobile lead | Share of swaps handled in the app |
| 2 | One screen for all shift rules (2, -1, H and O) | Design lead | Time to set shift rules |
| 3 | Side-by-side check view (3, 0, H and O) | Design lead | Rotas published without the spreadsheet |
Pick each metric from the key performance indicators (KPIs) the owner already reports, so the map's metrics and KPIs need no new dashboard. A journey map is a living document; the FAQ on updates gives our review cadence. For a real case, see how we mapped the Vocable creator journey: the team mapped the full creator journey and designed each screen around a problem heard in stakeholder interviews, across planning, drafting, optimizing and publishing.
A map of mostly A cells cannot settle a priority argument, and when a team disagrees about priorities without shared personas or journey maps, we advise investing in UX research. Put an owner's name in every Opportunities cell before the meeting ends.
Which customer journey map mistakes waste the template?
Six customer journey map mistakes waste the template, and the worst is presenting an assumption-only map as user research, because nobody can then tell guesses from findings.
- Assumed cells sold as research, because the map hides its guesses; the evidence lane shows every A.
- Several personas on one grid, because their emotion curves cancel out; draw one map each.
- Funnel stages on a product task, because "Consideration" names no screen; name stages from clusters.
- An emotion curve with no quotes, because a -2 nobody said is a guess; quote every point.
- Too many lanes, because nobody reads a 14-lane map; keep 8.
- A map never updated, because cells go stale after releases; date the evidence lane.
Before you share a map, check that every quote carries a participant ID, every cell an evidence level and the header a review date; send any map that fails back to the step that owns it.
When should researchers build your customer journey map?
A customer journey map needs user researchers when it must settle a product decision, its users are hard to observe, or most of its cells are still assumed.
The personas and journey maps our research program delivers are 2–4 personas with 1 journey map each, built from 10–15 interviews per user group and contextual inquiry, tagged in Dovetail and presented in a 90-minute readout. The program costs $25,000–$60,000; see what a 4–8 week research program costs and, when comparing providers, how to choose a UX research agency.
Filled from team knowledge alone, a customer journey map template becomes a hypothesis map, and each A cell names a question the evidence table can assign a method to. The proposal can be scoped around those open cells once you send us the hypothesis map you already have. Every project begins with a free consultation and a fixed-scope proposal.
FAQs
How do you make a customer journey map in PowerPoint?
Insert our SVG file with Insert > Pictures, then right-click it and use the Convert to Shape option to edit each piece of the grid separately. Microsoft's guide to editing SVG images in Microsoft 365 describes that option; for a table instead, paste the CSV grid into a PowerPoint table.
How do I create a user journey map?
Pick one user type and one product task, then fill the template from 10–15 user interviews per user group and on-site observation of 4–6 users. Name the stages after the task's steps and validate with participants, following the 7 steps above.
Can you build a customer journey map template in Excel or Google Sheets?
Yes. Open our CSV file in Excel, Google Sheets or Numbers: the header fields sit on top, column A lists the 8 lanes and columns B to F hold the five stages. A spreadsheet suits evidence notes and links to recordings, while a Miro or FigJam board suits a workshop.
How many personas should one journey map cover?
One per map, following one scenario, so the emotion curve and quotes share one point of view. Our research program builds 2–4 personas with 1 journey map each; when two of them share a journey, map both and compare the curves.
Can AI create a customer journey map?
Yes, but only as a first draft. An artificial intelligence (AI) tool such as ChatGPT can propose stages and fill a hypothesis map, yet every cell it writes stays an A until interviews or observation back it.
How often should you update a customer journey map?
Update it after each new study or major release that touches the journey; that review cadence is our practice, not a published standard. Date every evidence entry, so stale cells show and the next study can target them.