3–5 days
Data audit and questions
We review the datasets and list the questions each audience asks of the data.

Charts, interactive reports, and visual stories that help people understand complex data at a glance and act on it.





Get a free consultation
Free consultation · reply within one business day
In shortA data visualization agency turns complex datasets into charts, interactive reports and visual stories, with the chart type, visual encoding and chart accessibility chosen for each question. Our data visualization projects take 4–8 weeks, cost $25,000–$60,000, and end with a visualization style guide and D3.js-ready specs.
Data visualization is the practice of encoding data as position, length, colour and shape, so people compare values and see patterns without reading a table. A data visualization agency chooses the chart type, the visual encoding and the annotations for each question in the data.
Data visualization design goes deeper than dashboard design services: a dashboard combines standard charts, while data visualization design builds interactive charts and data storytelling pieces, for example a D3.js network graph or an annotated scrolling report.
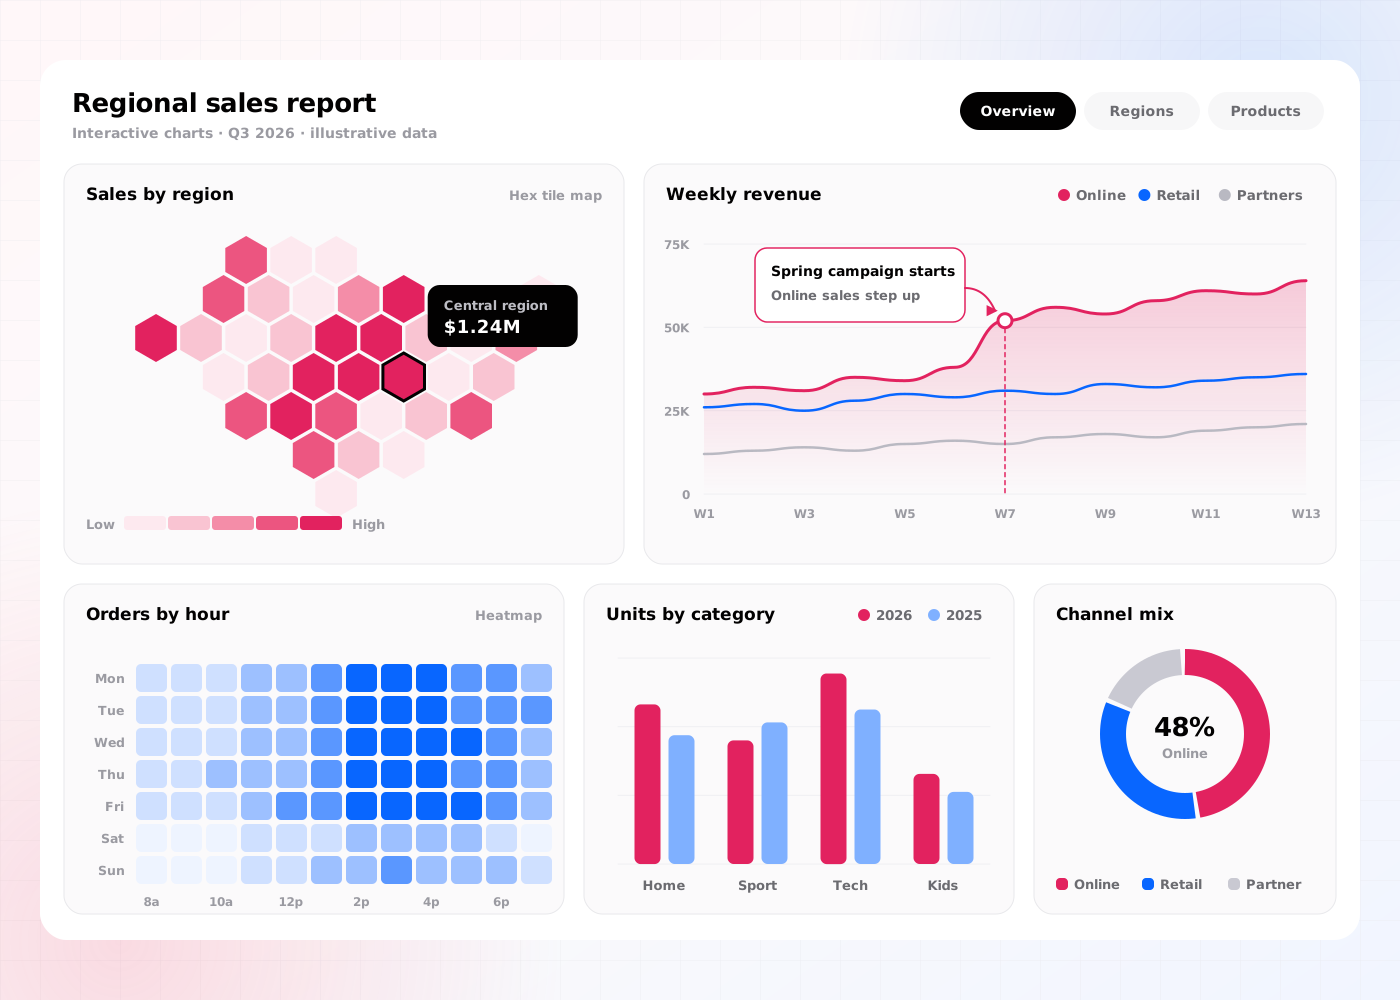
Our data visualization agency services include 6 deliverables: a data audit, a chart selection matrix, a visualization style guide, interactive chart prototypes, a chart accessibility spec and a developer handoff.
A review of the datasets, fields and update frequency, for example daily sales by region or hourly sensor readings.
Rules that match each question to a chart type, for example small multiples for comparisons across 6 regions. Our guide to the types of charts matches each data question to a best, runner-up and avoid chart.
Colour scales, typography, axis and annotation rules, for example ColorBrewer sequential scales for ordered values.
Clickable prototypes in Figma or Observable, for example hover tooltips, brushing and filtering.
Rules that meet Web Content Accessibility Guidelines (WCAG) 2.2, for example 3:1 contrast for chart marks, text alternatives and a data table for screen reader users.
Specs for D3.js or Vega-Lite, for example scales, domains, margins and transition timings.
The data visualization process takes 4–8 weeks (20–40 working days) and runs in 5 steps, from data audit to developer handoff.
We review the datasets and list the questions each audience asks of the data.
Designers match each question to a chart type and sketch 2–3 visual encodings per question.
Designers build interactive charts in Figma or Observable with real data samples.
Users from each audience answer 5 questions with the charts, and designers check every chart against WCAG 2.2.
We hand over the visualization style guide and D3.js or Vega-Lite specs to developers.
Data visualization has 4 benefits: it increases report engagement, improves data literacy, reduces time to insight and develops a visual language for data.
Annotated charts and data storytelling increase the share of readers who finish a report.
Clear chart types and plain annotations improve how accurately non-analysts read the data.
Visual encoding by position and length reduces the time readers spend comparing values.
A shared style guide develops one colour and chart system across reports, dashboards and presentations.
Data visualization builds custom charts and visual stories for specific questions; dashboard design builds screens of standard charts for daily monitoring. Teams that publish data reports choose data visualization.
| Criterion | Data visualization | Dashboard design |
|---|---|---|
| Main output | Custom charts, interactive reports and visual stories | Dashboard screens and a component kit |
| Chart types | Custom, for example Sankey, network and small-multiple charts | Standard line, bar, key performance indicator (KPI) card and table components |
| Tools | D3.js, Vega-Lite and Observable | Figma, Storybook, Tableau and Power BI |
| Timeline | 4–8 weeks | 4–8 weeks |
| Price on this site | $25,000–$60,000 | $25,000–$60,000 |
Data visualization costs $25,000–$60,000 and takes 4–8 weeks. The price depends on 4 factors: the number of charts, the level of interactivity, the number of datasets and the depth of the chart accessibility spec.
A set of 8–10 static charts with a visualization style guide sits near $25,000. An interactive report with 15 or more interactive charts, 3 datasets and a full chart accessibility spec sits near $60,000. Teams that need the charts inside a product continue with web app design services.
A data team should hire a data visualization agency in 5 situations:
Book a 45-minute UX audit session. We review your product and identify the top three friction points.
Book a UX auditWe design UI and UX for Finance, Healthcare and Supply chain products.
Send us your project. A design lead reviews it and schedules a call within one business day. We sign an NDA before the first technical discussion if you prefer.
These answers cover the 5 questions buyers ask most about a data visualization agency.
Still have a question?
A design lead answers every message within one business day.
Talk to a design leadYes. A data visualization agency project delivers D3.js or Vega-Lite specs, and Observable prototypes use D3.js with real data.
Yes. Accessible data visualizations meet WCAG 2.2 with 3:1 contrast for chart marks, text alternatives and a data table for screen reader users.
No. Data visualization builds custom charts for specific questions, while a dashboard combines standard charts for daily monitoring.
Yes. Data visualization design covers Tableau and Power BI, with colour scales and chart rules applied in the formatting settings of each tool.
A data visualization project takes 4–8 weeks, which equals 20–40 working days, from data audit to developer handoff.