3–5 days
Audit and inputs
We review the current dashboard, the data model and the brand, and agree the screens in scope.

Clean layouts, readable charts, and reusable dashboard components, designed for the screens and environments your users actually work in.





Get a free consultation
Free consultation · reply within one business day
In shortDashboard design services create the visual user interface (UI) of analytics, operations and admin dashboards on top of a tested user experience (UX) structure: layouts, chart styles and a reusable component kit. Our dashboard design services take 4–8 weeks, cost $25,000–$60,000, and end with high-fidelity Figma screens and a developer-ready handoff.
Dashboard design is the visual UI design of a screen that shows metrics, charts and tables for monitoring or analysis. Designers set the layout grid, chart selection, colour palette and data density, for example a 12-column grid with a row of 4 key performance indicator (KPI) cards over the main chart.
Dashboard design builds on dashboard UX design, which decides the metrics and hierarchy first. An analytics dashboard, an operations dashboard and an admin dashboard use one dashboard UI kit with different layouts, for example a chart-heavy analytics view and a table-heavy admin view.
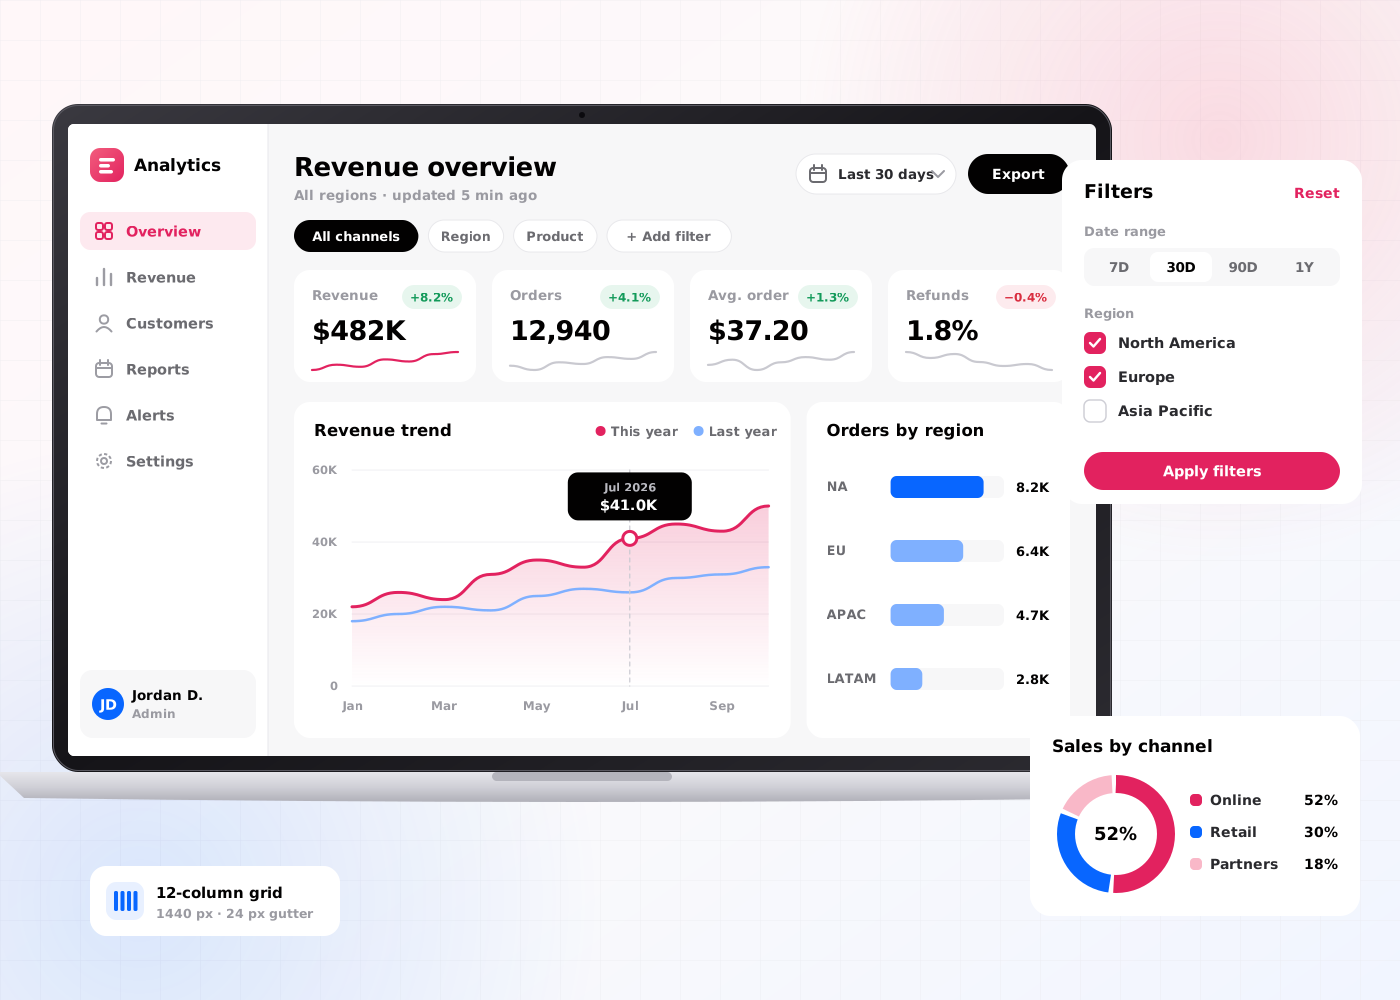
Our dashboard design services include 6 deliverables: a layout grid, a chart selection guide, a colour palette for data, high-fidelity screens, a dashboard component kit and a developer handoff package.
A responsive grid for each screen size, for example 12 columns at 1440 px and 8 columns at 1024 px.
Rules that match each metric to one chart type, for example line charts for trends and bar charts for comparisons.
Categorical, sequential and status colours checked against Web Content Accessibility Guidelines (WCAG) 2.2, for example 3:1 contrast for chart lines against the background.
Final Figma screens in light and dark mode, for example the overview, detail and settings screens.
Reusable components built on design tokens, for example KPI cards, filters, data tables and chart containers.
Specs mapped to Storybook and to the chart library in use, for example Apache ECharts or Highcharts.
The dashboard design process takes 4–8 weeks (20–40 working days) and runs in 5 steps, from audit to developer handoff.
We review the current dashboard, the data model and the brand, and agree the screens in scope.
Designers set the layout grid and match every metric to a chart type.
Designers design high-fidelity screens in Figma in light and dark mode and check contrast against WCAG 2.2.
Designers build KPI cards, filters, tables and chart containers on design tokens in one Figma library.
We hand over specs mapped to Storybook and review the first coded screens against the Figma files.
Dashboard design has 4 benefits: it increases dashboard usage, improves chart readability, reduces development time and develops a consistent dashboard UI.
Readable layouts and clear charts increase the share of users who open the dashboard each week.
One chart type per question and a tested colour palette improve how fast users read each value.
A component kit on design tokens reduces the front-end hours spent on each new dashboard screen.
Every new dashboard reuses the same kit, so the dashboard UI develops as one system across products.
Dashboard design shapes how a dashboard looks and how developers build the dashboard; dashboard UX design decides which metrics each role sees. Teams with a validated dashboard structure start with dashboard design services.
| Criterion | Dashboard design | Dashboard UX design |
|---|---|---|
| Focus | Layout, chart styles, colour and components | Metrics, hierarchy, workflows and alerts |
| Main output | High-fidelity screens and a component kit | Dashboard information architecture and tested prototype |
| Key question | Which chart shows each metric clearly? | Which decision does each view support? |
| Timeline | 4–8 weeks | 4–8 weeks |
| Price on this site | $25,000–$60,000 | $25,000–$60,000 |
Dashboard design costs $25,000–$60,000 and takes 4–8 weeks. The price depends on 4 factors: the number of screens, the number of chart types, the number of themes and the size of the component kit.
An analytics dashboard with 5–6 screens and 1 theme sits near $25,000. An admin dashboard suite with 20 screens, light and dark mode and a full component kit sits near $60,000. Teams that need custom interactive charts add a data visualization agency scope.
A product team needs dashboard design services in 5 situations:
Book a 45-minute UX audit session. We review your product and identify the top three friction points.
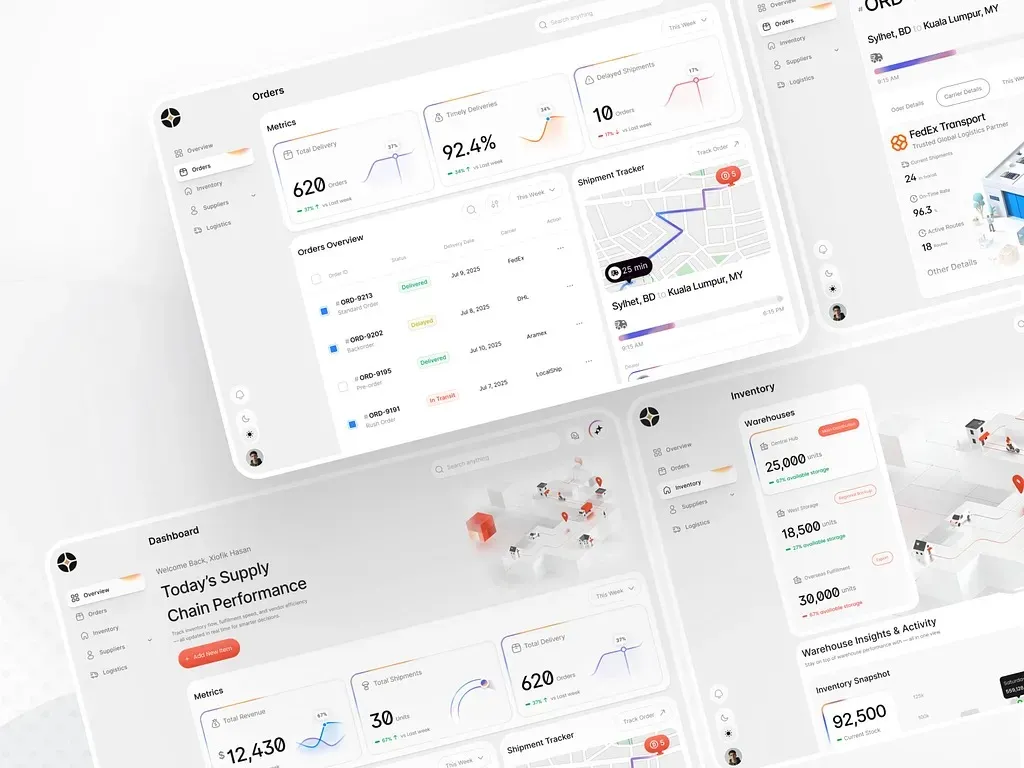
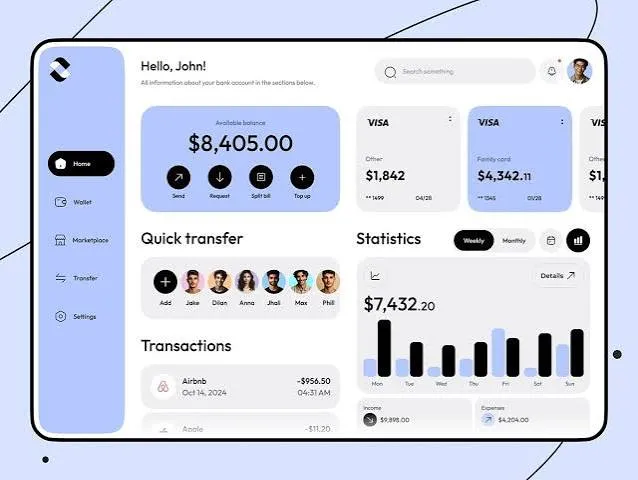
Book a UX auditWe design UI and UX for Supply chain and Finance products.
Send us your project. A design lead reviews it and schedules a call within one business day. We sign an NDA before the first technical discussion if you prefer.
These answers cover the 5 questions buyers ask most about dashboard design services.
Still have a question?
A design lead answers every message within one business day.
Talk to a design leadYes. Dashboard design services cover Tableau, Power BI and Looker dashboards, with layout and colour rules for each tool. For Power BI, that means the report canvas, the report theme values and the mobile layout, set out step by step in our guide to Power BI dashboard design.
Yes. Dashboard design includes a dark mode option, with every chart colour checked against WCAG 2.2 contrast in both themes.
No. Dashboard design sets the visual UI and components, while dashboard UX design sets metrics, hierarchy and workflows.
Yes. An admin dashboard redesign reuses the product's design tokens and adds dashboard components, for example data tables and filters.
Dashboard design takes 4–8 weeks, which equals 20–40 working days, from audit to developer handoff.