

Key takeaways
- Measuring research shows how many users a problem affects and how much; qualitative research shows why it happens.
- Nielsen Norman Group's 40-participant guideline assumes a binary metric and a 15% margin of error at 95% confidence.
- A System Usability Scale score of 68 is the average, the 50th percentile, not 68% and not a pass mark.
- When a metric moves and nobody knows why, measure first, then interview the users behind the number.
- A low-traffic product can skip A/B tests and recruit about 40 participants for a usability benchmark instead.
Two reports land on one desk on the same day and seem to disagree, and the disagreement shows what quantitative UX research measures and what its qualitative partner explains. A moderated usability round says 4 of 5 new staff missed the shift-swap button in a staff scheduling app, while a survey of a few hundred app users says most rate swapping shifts as easy. Both are right: the round watched 5 people attempt one task, and the survey counted opinions from many people, most of whom set up their first swap long ago. We invented the app to show the split.
Most studies in user experience (UX) research land on one side of that split, measuring how many or explaining why. The explaining side, user interviews and contextual inquiry, is what our UX research services center on, together with card sorts and tree tests that put numbers on a menu. Which report to trust, and when you need both, depends on the methods, metrics and sample sizes on the counting side.
What is quantitative UX research?
Quantitative UX research measures user behavior and attitudes as numbers, such as task success rates and survey scores, to show how many users a problem affects and how much.
It is one of the two data types of UX research, also called user research; the other, qualitative UX research, follows in the next section. Teams also call it quant UX research or quantitative user research, and its numerical data comes from two sources:
- Behavioral numbers record what people do, through product analytics, A/B testing and task success in a usability test.
- Attitudinal numbers record what people say, through survey questionnaires and System Usability Scale (SUS) ratings.
Market research sizes demand and segments buyers; this work measures how people use and rate a product. A number shows that a problem exists and how big it is, not why, so it never tells a designer what to change on its own. Write the question you want a number for before you pick a tool.
What does a quantitative UX researcher do?
A quantitative UX researcher designs surveys, analyzes product logs and analytics, runs experiments and usability benchmarks, and turns the results into product decisions about users.
Chris Chapman and Kerry Rodden's book Quantitative User Experience Research (Apress, 2023) describes Quant UX as its own role, explains how it differs from data science, and has chapters on statistics, programming, metrics of user experience, customer satisfaction surveys and log sequence visualization; Rodden also originated the HEART framework.
Is artificial intelligence (AI) replacing UX research? No: AI speeds up transcription, coding and first-pass analysis, but synthetic users, AI-generated stand-ins for research participants, cannot replace studying and speaking with real people, the conclusion of Nielsen Norman Group's article on synthetic users. A team without a Quant UX researcher can start from the metrics section below.
Qualitative vs quantitative UX research, what each proves
Quantitative user research proves how many users hit a problem and how big it is, while qualitative user research proves why it happens and what to change.
That makes the qualitative vs quantitative UX research choice a matter of which question you need answered first. Qualitative UX research watches and talks to small samples of people and returns reasons and patterns, not rates. In its article on quantitative vs qualitative usability testing, Nielsen Norman Group (NN/g) calls quantitative data an indirect assessment of usability, built on task performance or satisfaction ratings, and qualitative observation a direct one.
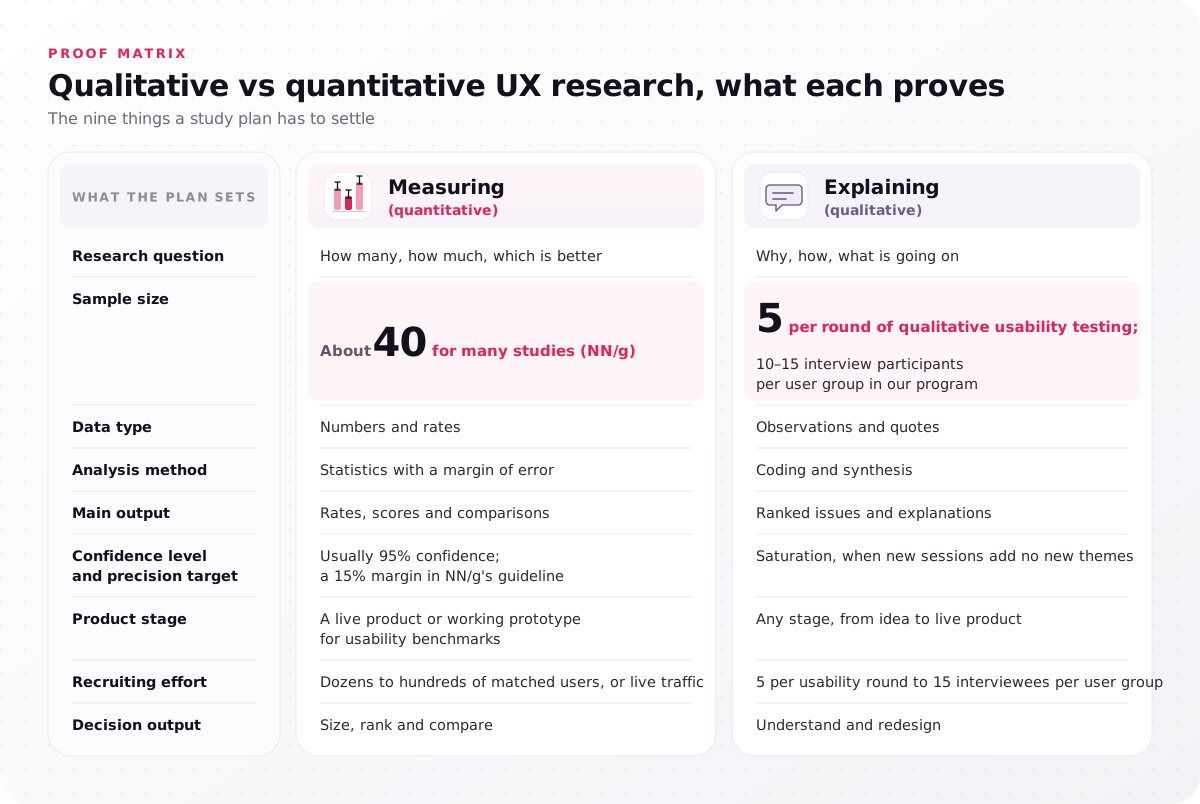
Five sessions find problems but do not generalize to a rate, and a few hundred ratings do not show where anyone got stuck. The table compares the two on the nine things a study plan has to settle.
| What the plan sets | Measuring (quantitative) | Explaining (qualitative) |
|---|---|---|
| Research question | How many, how much, which is better | Why, how, what is going on |
| Sample size | About 40 for many studies (NN/g) | 5 per round of qualitative usability testing; 10–15 interview participants per user group in our program |
| Data type | Numbers and rates | Observations and quotes |
| Analysis method | Statistics with a margin of error | Coding and synthesis |
| Main output | Rates, scores and comparisons | Ranked issues and explanations |
| Confidence level and precision target | Usually 95% confidence; a 15% margin in NN/g's guideline | Saturation, when new sessions add no new themes |
| Product stage | A live product or working prototype for usability benchmarks | Any stage, from idea to live product |
| Recruiting effort | Dozens to hundreds of matched users, or live traffic | 5 per usability round to 15 interviewees per user group |
| Decision output | Size, rank and compare | Understand and redesign |
The analysis method shapes the main output: statistics return a rate with a margin of error, while coding returns ranked issues. That in turn sets the decision output, size and compare on one side, understand and redesign on the other. Each side fails alone, because numbers without reasons push teams to guess at fixes, and reasons without numbers cannot rank fixes or show that one worked. Label your open question "how many" or "why" before anyone opens a survey tool.
Which quantitative UX research methods fit which question?
Quantitative UX research methods include surveys, product analytics, A/B testing, quantitative usability testing, tree testing and first-click testing, and each one counts how many users do or prefer one thing.
UX research methods as a whole split by data type, qualitative or quantitative, and by data source, attitudinal or behavioral, and the full map of UX research methods places the qualitative ones too. Much UX quantitative research reuses data you already hold, such as web analytics in Google Analytics, while the rest needs recruited participants or live traffic; eyetracking also counts but needs special equipment.
The table compares seven methods, six of them from NN/g's overview of quantitative user-research methodologies, by question, typical sample, the metric each returns and whether it needs a live product.
| Method | Question it answers | Typical sample | Metric it returns | Live product? |
|---|---|---|---|---|
| Surveys | What share of users report a view, need or rating | Sized to the margin you need, about 400 for ±5 points | Percentages, rating scores | No |
| Product analytics | Which steps of a flow users reach, repeat or abandon | Every user your tracking already logs | Funnel analysis, drop-off, heatmaps | Yes |
| A/B testing | Whether a live change beats the current version | Enough live visitors to reach statistical significance | Conversion rate difference | Yes |
| Quantitative usability testing | How often and how fast users finish set tasks | About 40 participants (NN/g) | Task success rate, time on task, errors, SUS | Prototype or live product |
| Tree testing | How often users pick the right branch to find an item | 30–50 participants in our program | Findability per task | No, a text tree |
| Card sorting at scale | Which items most users file together | 30–50 participants in our program | Similarity scores | No |
| First-click testing | Where users click first on a screen | 20–50 in our unmoderated studies | First-click success | No, a mockup |
What is quantitative usability testing?
Quantitative usability testing has dozens of participants attempt the same tasks, so the team can report task success rate, time on task and errors with a margin of error.
NN/g describes it as close to a controlled experiment built to capture metrics, while a qualitative test sets out to find interface problems, so tasks and structure differ. Repeating the same tasks release after release is usability benchmarking. Our usability testing services have every participant answer the System Usability Scale and the Single Ease Question (SEQ), and run unmoderated studies with 20–50 participants in Maze or UserTesting. Give each task one clear success state before a usability benchmark starts.
What are 5 examples of quantitative UX research?
Five common examples are a survey, a funnel report, an A/B test, a usability benchmark and a tree test, shown here on the illustrative shift-swap feature.
- Survey: five questions to every account admin about how easily their staff change shifts.
- Funnel report: how many sessions open the swap screen, and how many send a request.
- A/B test: two button placements, compared on swap requests per active user.
- Usability benchmark: 40 recruited staff attempt the swap task, scored on success and time.
- Tree test: where 30–50 participants look for shift swapping in a text-only menu.
Run the one whose number would change your next design decision.
Which qualitative UX research methods explain each number?
Qualitative UX research methods, such as user interviews, contextual inquiry, moderated usability testing and diary studies, each explain a specific kind of number.
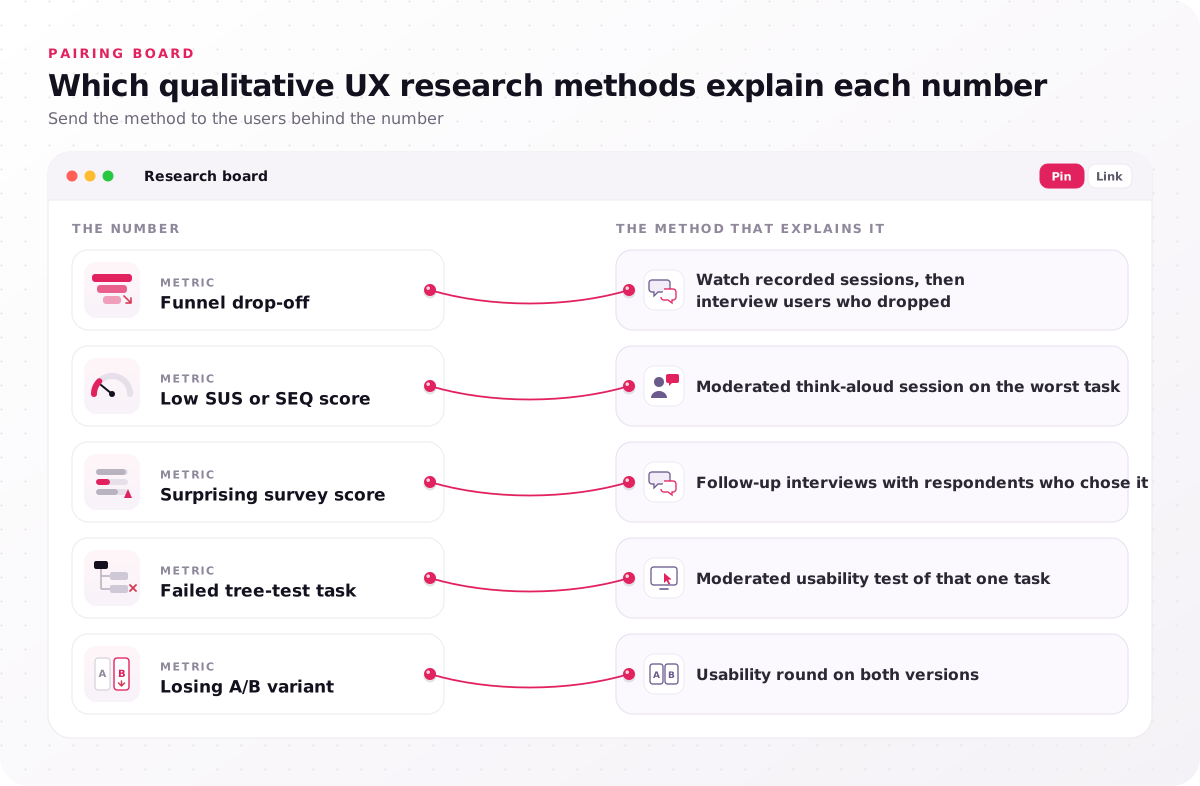
Send the method to the users behind the number: a funnel drop-off, for example, calls for watching recorded sessions, then interviewing people who left at that step.
- Funnel drop-off → watch recorded sessions, then interview users who dropped
- Low SUS or SEQ score → moderated think-aloud session on the worst task
- Surprising survey score → follow-up interviews with respondents who chose it
- Failed tree-test task → moderated usability test of that one task
- Losing A/B variant → usability round on both versions
When the number comes from work away from the screen, such as staff who arrange swaps on a break-room whiteboard, contextual inquiry shows the real routine. A retention rate that sags after the first month calls for a diary study, in which the same participants log each time they use or skip the feature over several weeks. Pin each metric on your dashboard to the method that would explain it.
Which UX metrics does quantitative UX research track?
Quantitative research in UX measures behavior with UX metrics such as task success rate, time on task and conversion rate, and attitudes with SUS scores and Net Promoter Score.
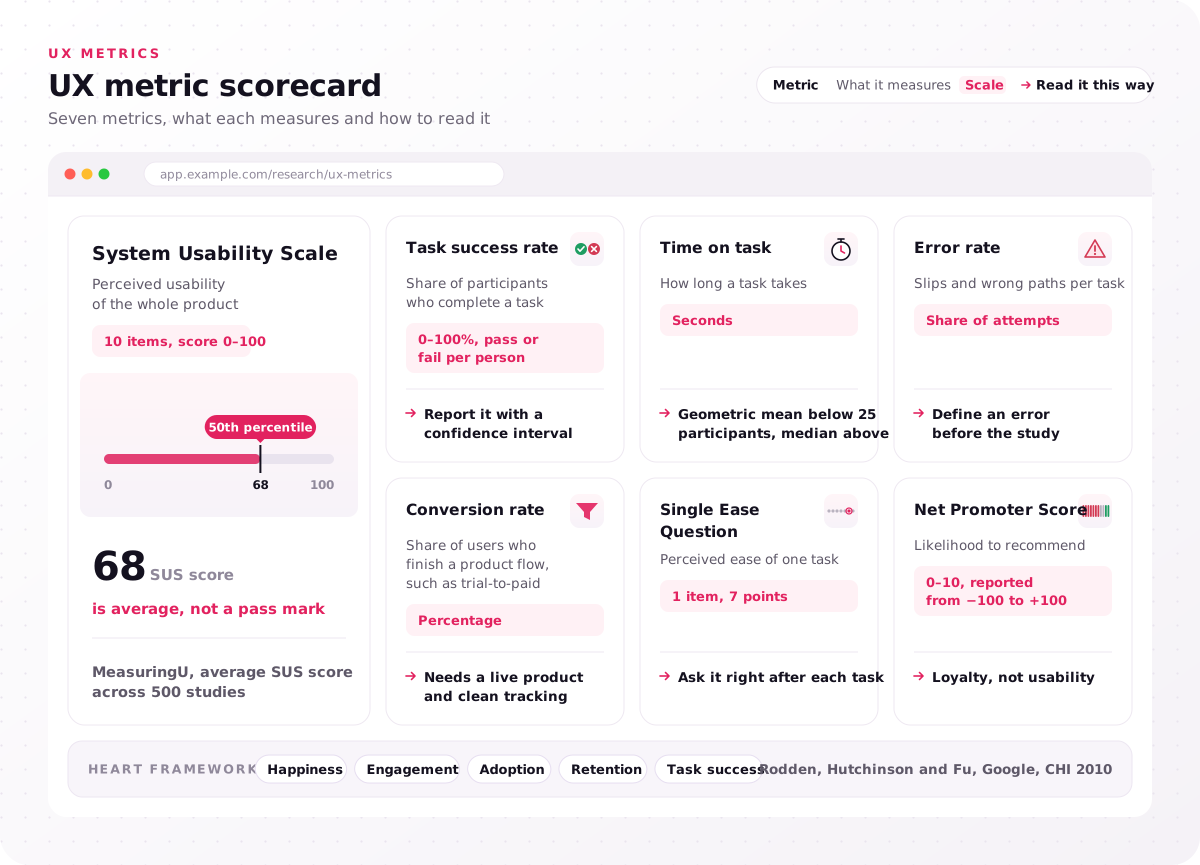
The scorecard lists seven metrics with what each measures, its scale and how to read it.
| Metric | What it measures | Scale | Read it this way |
|---|---|---|---|
| Task success rate | Share of participants who complete a task | 0–100%, pass or fail per person | Report it with a confidence interval |
| Time on task | How long a task takes | Seconds | Geometric mean below 25 participants, median above |
| Error rate | Slips and wrong paths per task | Share of attempts | Define an error before the study |
| Conversion rate | Share of users who finish a product flow, such as trial-to-paid | Percentage | Needs a live product and clean tracking |
| System Usability Scale | Perceived usability of the whole product | 10 items, score 0–100 | 68 is average, not a pass mark |
| Single Ease Question | Perceived ease of one task | 1 item, 7 points | Ask it right after each task |
| Net Promoter Score | Likelihood to recommend | 0–10, reported from −100 to +100 | Loyalty, not usability |
Two of these are misread most. MeasuringU's Jeff Sauro reports that the average SUS score across 500 studies is 68, the 50th percentile, so 68 means average, not 68% or a pass; a score above 68 is above average. Task times skew right, and MeasuringU's analysis of average task times found the geometric mean less biased than the median in samples under 25.
For product-level tracking, the HEART framework from Kerry Rodden, Hilary Hutchinson and Xin Fu of Google, presented at the 2010 Conference on Human Factors in Computing Systems (CHI), names five categories: happiness, engagement, adoption, retention and task success. It ties each category to goals, signals and metrics. Retention shows up in real product results too: our TradeZella trading journal case study reports gains in user interaction and user retention after its dashboard revamp.
Pick one primary metric per research question and record its baseline before the change ships. In our work, the usability testing service scores SUS and SEQ for every participant, and our research program's card sorts and tree tests report grouping and findability scores.
How many participants does quantitative UX research need?
Quantitative UX research needs about 40 participants for many studies, per Nielsen Norman Group, against 5 per round of qualitative usability testing, because a measurement needs a small margin of error.
NN/g's 40-participant guideline rests on stated assumptions: a binary metric such as task success, a 15% margin of error, so the true score sits within 15 points of the observed one, and a 95% confidence level. That 15% is the precision target; the confidence level says how sure you are that the true value sits inside it. Together they set a confidence interval, the range the true value probably falls in, and the margin of error is half its width.
The ruler compares the worst-case margin of error for a task success rate at five sample sizes. We computed it with the normal approximation, 1.96 × √(0.25 ÷ n), widest at a 50% success rate; below 40 participants the approximation is rough, so read those rows as rough guides.
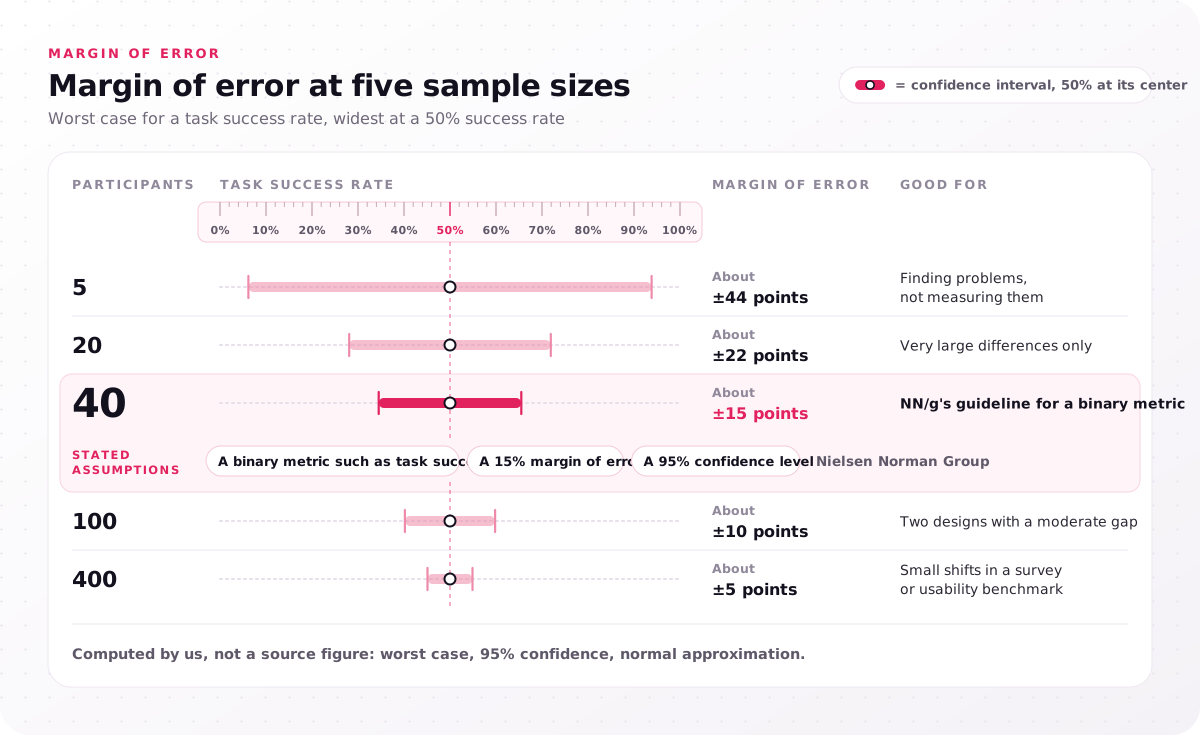
Computed by us, not a source figure: worst case, 95% confidence, normal approximation.
| Participants | Margin of error | Good for |
|---|---|---|
| 5 | About ±44 points | Finding problems, not measuring them |
| 20 | About ±22 points | Very large differences only |
| 40 | About ±15 points | NN/g's guideline for a binary metric |
| 100 | About ±10 points | Two designs with a moderate gap |
| 400 | About ±5 points | Small shifts in a survey or usability benchmark |
Other methods size differently: card sorts and tree tests run with 30–50 participants in our program, and surveys are sized by the margin you need. For A/B testing, the traffic needed is enough live visitors to reach statistical significance, a result unlikely to come from chance alone, which many low-traffic business-to-business (B2B) products do not reach in a useful time.
Count each user group separately, because admins and staff each need a representative sample. Software as a service (SaaS) products make this concrete, and our B2B SaaS design research covers administrators, end users and security reviewers separately. That recruiting effort comes first: in our program, participant recruitment takes 3–6 days of screening through a recruitment panel or your customer list. Count the matched users you can reach in each group before you promise anyone a percentage.
When to use quantitative UX research instead of qualitative
Choose quantitative studies when the question asks how many, how often or which version wins and you can reach enough users; choose qualitative UX research for why and how.
Not yet knowing what to count is the other reason to start qualitative. The decision tree routes a study through four questions, in this order.
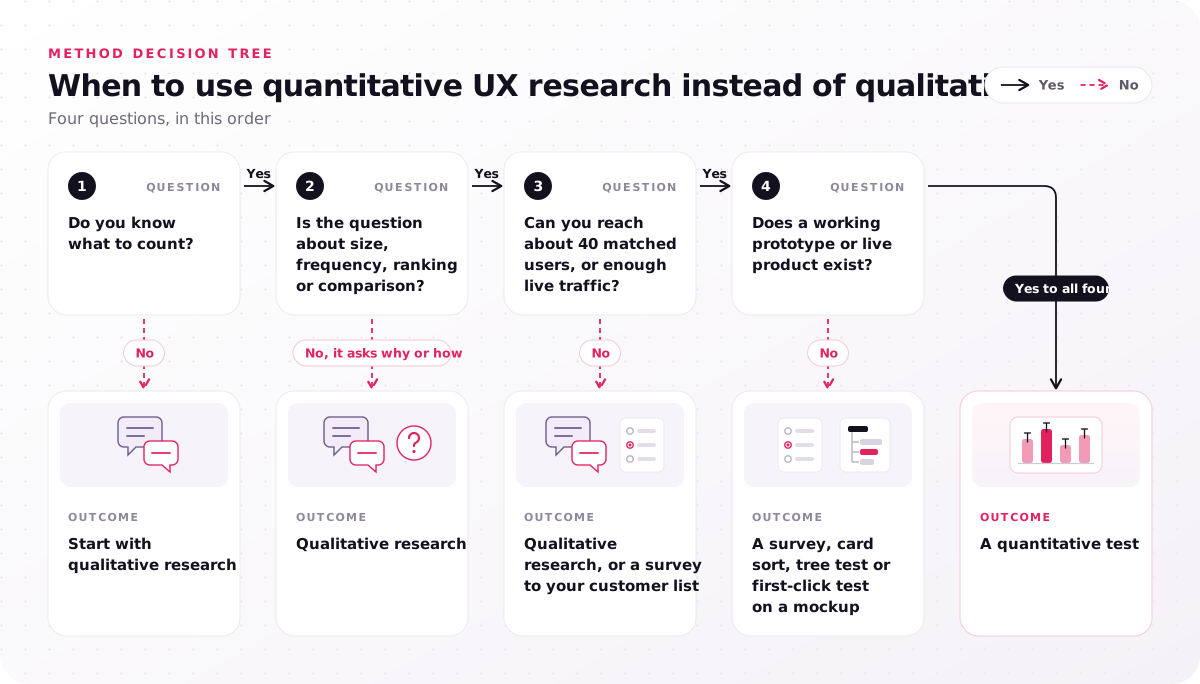
- Do you know what to count? No → start with qualitative research.
- Is the question about size, frequency, ranking or comparison? No, it asks why or how → qualitative research.
- Can you reach about 40 matched users, or enough live traffic? No → qualitative research, or a survey to your customer list.
- Does a working prototype or live product exist? No → a survey, card sort, tree test or first-click test on a mockup.
- Yes to all four → a quantitative test.
Product stage shifts the odds: discovery leans qualitative, usability benchmarks need a working prototype or live product, and A/B tests need live traffic after launch, which mirrors the split between generative and evaluative research. A low-traffic B2B product still gets numbers without an A/B test; the FAQs list three ways.
The question word picks the method, as three illustrative rewrites from the scheduling app show:
- "Do staff like the new swap screen?" becomes "How many staff send a swap request unaided?", a usability benchmark.
- "Why do managers reject swap requests?" stays a why question for user interviews.
- "Is the button in the right place?" becomes "Which of two placements gets more requests?", an A/B test if traffic allows.
Rewrite your next study request around its question word before you choose a method.
How to combine qualitative and quantitative UX research
You combine qualitative and quantitative UX research with one of three mixed methods research designs: measure then explain, explore then count, or run both at once and compare.
The designs come from John Creswell and Vicki Plano Clark's mixed methods work, and research centers such as Harvard Catalyst teach the basic mixed methods designs, adapted from Creswell, where the convergent design appears as a convergent parallel design.
- Explanatory sequential design: quantitative first, then qualitative to explain the results; use it when a number moved and nobody knows why.
- Exploratory sequential design: qualitative first, then a quantitative instrument, such as a survey that tests a hypothesis from interview themes; use it when you do not know what to count.
- Convergent design: both at once, compared at the end; use it when time is short and both kinds of data exist.
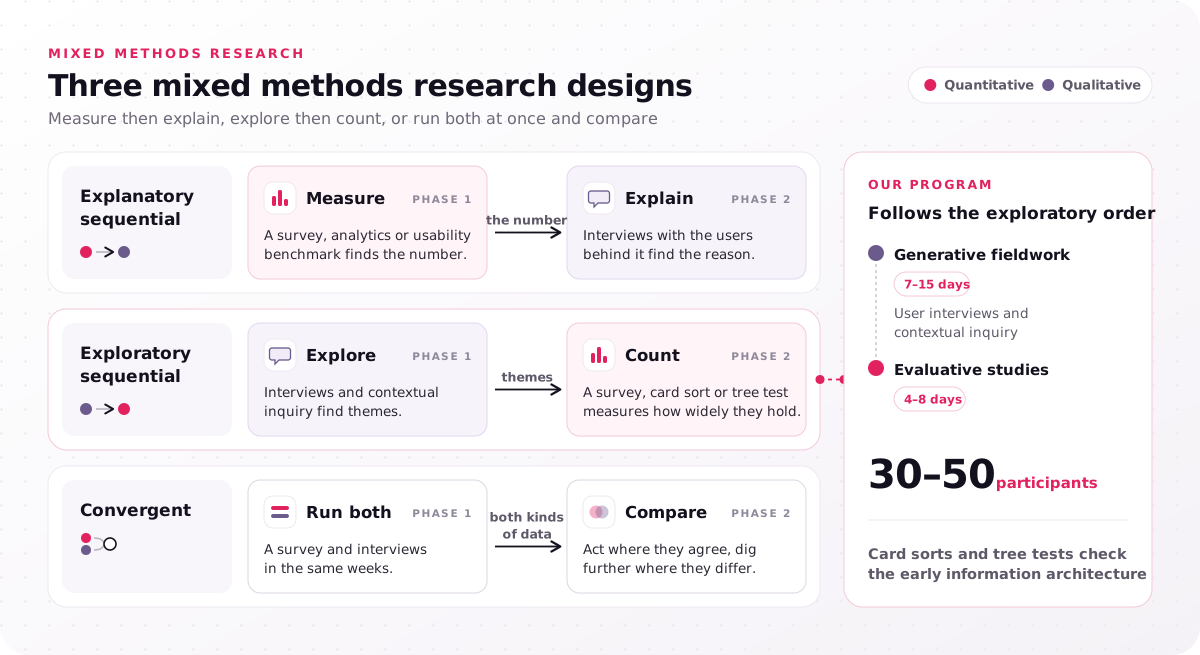
Explanatory sequential:
- Measure: a survey, analytics or usability benchmark finds the number.
- Explain: interviews with the users behind it find the reason.
Exploratory sequential:
- Explore: interviews and contextual inquiry find themes.
- Count: a survey, card sort or tree test measures how widely they hold.
Convergent:
- Run both: a survey and interviews in the same weeks.
- Compare: act where they agree, dig further where they differ.
Triangulation is the payoff: when you triangulate, two kinds of evidence that agree make a finding safer to act on. In the illustrative scheduling app, the explanatory order would read analytics for how many staff ever open the swap screen, interview staff who never use it to separate those who missed it from those who swap by text message, then measure the redesigned flow with a 40-person usability benchmark.
Our program follows the exploratory order: generative fieldwork (7–15 days) of user interviews and contextual inquiry, then evaluative studies (4–8 days) in which card sorts and tree tests with 30–50 participants check the early information architecture. Our guide on how many participants a card sort needs explains that range.
When a metric moved and nobody can say why, the explanatory follow-up is interviews and contextual inquiry with the users behind it, the fieldwork step of our program. The price of a 4–8 week research program turns on user groups, participants, methods and recruitment difficulty, so count your user groups first.
Which quantitative UX research traps create false certainty?
Quant UX research creates false certainty when a measurement looks precise but is not, as with an A/B test stopped at its first statistically significant result.
Each trap has a fix you can set before the study runs.
- Peeking at an A/B test. Stopping when a result first crosses statistical significance inflates false wins, so fix the sample size or duration up front.
- Statistical without practical significance. A real but tiny lift is not worth shipping, so set the smallest change that matters before reading results.
- Novelty effect. Returning users click anything new for a while, so run the test until that fades.
- Double-barreled survey questions. "How easy and fast was swapping?" asks two things, so ask one neutral question per item.
- Averaging skewed task times. A few slow participants drag the mean up, so report the geometric mean or median.
- A research panel that is not your users. People who never schedule shifts rate the task differently, so screen on behavior.
- Renamed analytics events. A renamed event looks like a drop in use, so check tracking before reading a trend.
- Net Promoter Score (NPS) read as usability. A loyalty score cannot locate a usability problem, so pair it with a task metric.
A list does not replace a second reader, so have someone outside the study review its plan before the first participant joins.
Which roles run quantitative and qualitative UX research?
Teams with steady traffic and an analyst can run quantitative research in UX in-house; explaining why a number moved, and recruiting the users behind it, calls for a qualitative researcher.
Three roles cover the work:
- Product analyst or data scientist: analytics dashboards and A/B tests on live traffic.
- Quant UX researcher: surveys, usability benchmarks and experiment design centered on users.
- Qualitative researcher: user interviews, contextual inquiry and moderated usability tests.
The missing role decides what to bring in. The program fit for a team with numbers but no reasons is our research program, which includes participant recruitment through a recruitment panel or your customer list, user interviews and contextual inquiry, card sorts and tree tests with 30–50 participants in Optimal Workshop, and synthesis in Dovetail ending in a 90-minute readout. One sign you need it is feature adoption that stays low while analytics show usage but not the reason.
The two reports from the start stop clashing once each answers its own question, and neither says how many new staff get lost, which is the next study. If a number on your dashboard moved last quarter and nobody can say why, note the date it moved and the user group it covers. With those two facts in hand, send us the metric that moved while the change is recent enough for the users behind it to remember what happened. Every project begins with a free consultation and a fixed-scope proposal.
FAQs
Is a survey qualitative or quantitative?
Both, depending on its questions. Closed-ended questions with a rating scale or fixed options give quantitative data you can count, while open-ended questions give qualitative data you code for themes. Most product surveys mix the two, so decide which questions carry the numbers before you send it.
Is quantitative UX research better than qualitative UX research?
No. They prove different things: the quantitative side sizes a problem and the qualitative side explains it, so strong teams aim both at the same question with one of the mixed methods designs above.
What are the types of quantitative and qualitative research design?
Quantitative designs are commonly grouped into four, descriptive, comparative, quasi-experimental and experimental, in Sacramento State's research methods guide, and other textbooks group them differently. Qualitative research has five classic approaches in John Creswell and Cheryl Poth's book, narrative, phenomenology, grounded theory, ethnography and case study, and no single standard list of seven exists for either. In UX terms, a survey is descriptive, a usability benchmark against a prior release is comparative, a before-and-after launch comparison is quasi-experimental and an A/B test is experimental, while contextual inquiry descends from ethnography.
Can a low-traffic product run quantitative studies?
Yes, without A/B tests, because recruiting replaces traffic. Send a survey to your customer list, run an unmoderated usability benchmark with about 40 recruited participants, or run a tree test with 30–50 participants.
How long does a quantitative study take?
It depends on the method. An A/B test lasts as long as live traffic needs to reach the sample size you fixed in advance; card sorts and tree tests fit inside the 4–8 day evaluative studies step of our research program; and a survey needs days in the field plus time for analysis.
Do you need statistics skills for quantitative studies?
Yes, the basics: confidence intervals, margin of error and statistical significance. Jeff Sauro and James R. Lewis's Quantifying the User Experience (2nd edition, Morgan Kaufmann, 2016) teaches them as practical statistics for user research, and the Chapman and Rodden book covers the wider Quant UX role.