Key takeaways
- For a research study, UX ROI is gain minus cost, divided by cost, and most of the gain is build money not lost to a wrong assumption.
- Expected opportunity loss, the chance of being wrong times the cost of being wrong, is the most a study can be worth before it runs.
- Break-even doubt is the study cost divided by the cost of being wrong; fund the study when the team's honest doubt sits well above it.
- A study that confirms the plan was still worth funding if its expected value was positive on the day the money was approved.
- Few published ROI figures name a sample, a method and a period, so build the case from your own stake, doubt and decision rule.
Put one planned feature on a bet slip, "$300,000 on dispatchers wanting automatic job scheduling, 35% chance we are wrong", and UX ROI, the user experience (UX) return on investment (ROI) of a research study, turns into a sum you can check before anyone books a participant. The field-service product, its build stake and the odds are illustrative. The slip shows the trade a study offers: a known price now against the cost of being wrong later, weighted by its odds.
Product leads make that trade when they choose between funding UX research services and funding the build straight away. UX research, the study of users' goals and behavior through interviews, observation and tests, earns most of its return by changing a decision before code exists, so the method here prices the slip in five steps and ends in a five-line business case leadership can sign.
What is UX ROI, and what does it mean for a research budget?
UX ROI is the gain from user experience work minus its cost, divided by its cost, and for UX research most of the gain comes from decisions changed before the build.
As a formula, ROI = (gain − cost) ÷ cost × 100, so a $35,000 study that saves $70,000 of build work returns 100%. The denominator is the full study cost, including your own team's hours in sessions and at the readout.
What the ROI of UX means for a research budget differs from what it means for a redesign. A redesign changes screens, so its return arrives later as a higher checkout conversion rate or a lower support cost; a study changes decisions, so its largest return is money never spent on the wrong build. ROI questions often come in three shapes, a finished project, a proposed study and a tool purchase, and this guide prices the second.
Nielsen Norman Group (NN/g) argues that UX ROI calculations are estimates, not financial forecasts, and that the return your audience values can be impact, perception or retention as well as money.
What does a 10% or 24% ROI mean, and is it good?
A 10% ROI means the gain covered the cost plus one tenth more; whether 24%, 4.5% or 2% is good depends on the period and your finance team's hurdle rate.
On a $35,000 study, a 10% return means $38,500 came back. A hurdle rate is the minimum return a company requires before it funds any project, so compare against yours, not a generic benchmark; 24% earned in one quarter beats 24% spread over three years. Search engine optimization (SEO) uses the same formula, with organic revenue as the gain. Ask finance for your hurdle rate before you price a study.
Where does the ROI of user research come from?
The ROI of user research, or return on UX research, comes from three return streams: decision value, improvement value and reuse value.
Decision value is risk reduction priced in dollars: build money redirected when a finding stops, changes or confirms a plan, which is how user research reduces development waste. Improvement value is the measured gain after a better design ships, for example higher feature adoption or a better trial-to-paid conversion rate. Reuse value comes from a research repository, where findings tagged in Dovetail answer a later question without a new study.
Each stream pays out at a different moment and needs its own counting rule.
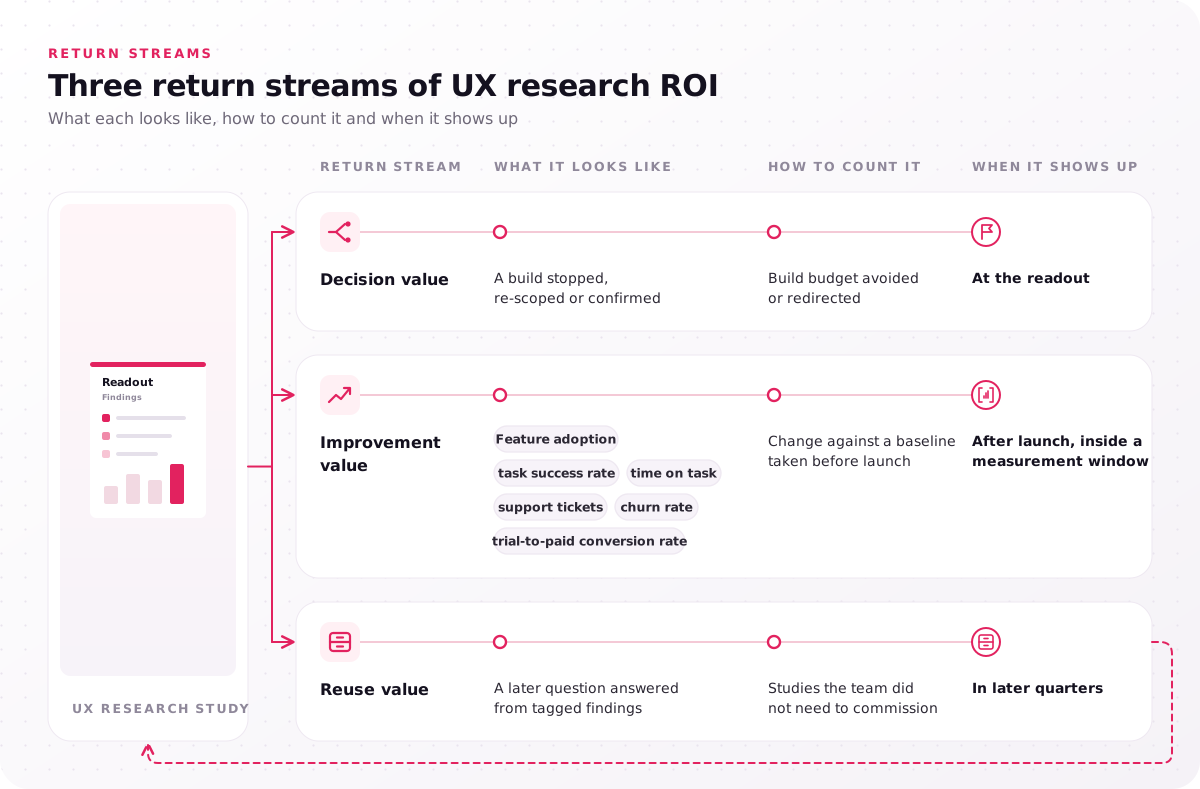
| Return stream | What it looks like | How to count it | When it shows up |
|---|---|---|---|
| Decision value | A build stopped, re-scoped or confirmed | Build budget avoided or redirected | At the readout |
| Improvement value | Feature adoption, task success rate, time on task, support tickets, churn rate, trial-to-paid conversion rate | Change against a baseline taken before launch | After launch, inside a measurement window |
| Reuse value | A later question answered from tagged findings | Studies the team did not need to commission | In later quarters |
Can every UX return be turned into money? No. Shared personas that end a priority argument, or stakeholders who trust the roadmap more, are real returns, but they belong on a separate line under the dollar total, so finance can check every dollar. Decision value can come from either mode of research: interviews find what to build, and testing concepts before development cuts the engineering weeks spent on features users do not need. Name the stream your next study should produce before you price it.
Which UX ROI statistics hold up when finance checks them?
Few UX ROI statistics survive a finance review, because most published figures describe design or usability averages, not what one UX research study will return.
Each figure carries an evidence grade, set by its sample, its method and whether it shows causation or only correlation. McKinsey's 2018 report The Business Value of Design tracked 300 publicly listed companies over five years and found 32 percentage points higher revenue growth for companies in the top quartile of the McKinsey Design Index than for industry peers. It measures design practice across whole companies, and it shows correlation.
Jakob Nielsen's 2008 NN/g article Usability ROI Declining, But Still Strong reported an average 83% improvement in the metrics measured after usability redesigns, lower than the firm's earlier survey. Published case studies are self-selected, so failed projects rarely enter the sample. Ronny Kohavi and colleagues' 2009 paper Online Experimentation at Microsoft gives a harsher figure from controlled experiments: roughly a third of the ideas tested improved the key metric they targeted. The authors note a selection effect, since teams send ideas to an experiment when they are less sure of them, and add that this bias is possibly smaller than most people think.
Grade a figure here before you quote it to finance.
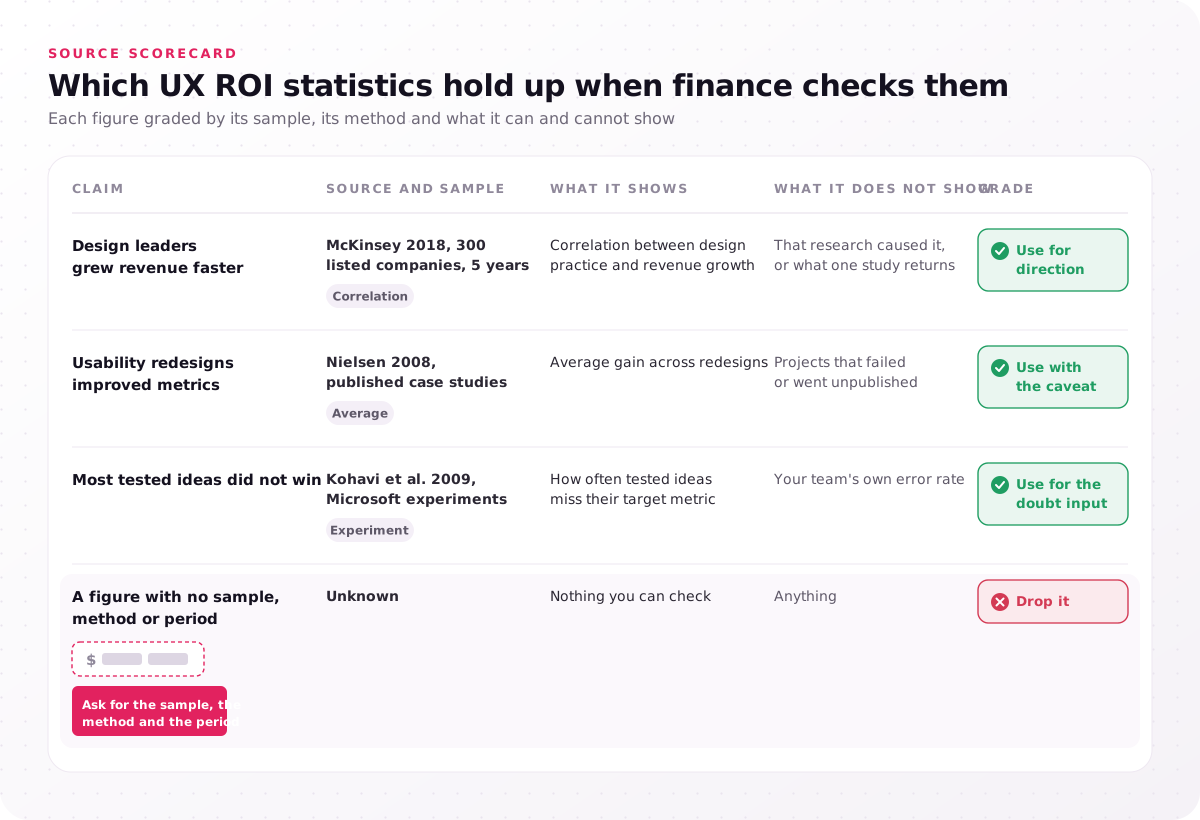
| Claim | Source and sample | What it shows | What it does not show | Grade |
|---|---|---|---|---|
| Design leaders grew revenue faster | McKinsey 2018, 300 listed companies, 5 years | Correlation between design practice and revenue growth | That research caused it, or what one study returns | Use for direction |
| Usability redesigns improved metrics | Nielsen 2008, published case studies | Average gain across redesigns | Projects that failed or went unpublished | Use with the caveat |
| Most tested ideas did not win | Kohavi et al. 2009, Microsoft experiments | How often tested ideas miss their target metric | Your team's own error rate | Use for the doubt input |
| A figure with no sample, method or period | Unknown | Nothing you can check | Anything | Drop it |
Decision value is missing from all three for a structural reason: the counterfactual, the feature that was never built, leaves no metric behind, so analytics cannot show the loss a study prevented. Other ROI figures circulate with no traceable method, including a dollar-return claim attributed to Forrester and percentages in the thousands; ask for the sample, the method and the period, and drop any figure that has none.
No average prices the UX return on investment of your own decision. Our article on what skipping UX research costs a product team lists those costs, and the next section turns them into one number for one decision.
How do you price a study against the cost of being wrong?
To price UX ROI before a research study, multiply the chance of being wrong by the cost of being wrong; that expected opportunity loss caps what the study is worth.
- Name the decision and its build stake, the build budget that rides on one assumption.
- Estimate the cost of being wrong, the share of the build stake lost if the assumption fails, since some work survives a change of direction.
- Estimate the chance of being wrong, the team's honest doubt, as a percentage, that the assumption is false.
- Multiply the two to get the expected opportunity loss, what the team stands to lose on average by building without evidence.
- Compare it with the study cost, and fund the study when its price sits well below that loss.
The method comes from decision analysis. Douglas Hubbard's book How to Measure Anything treats measurement as a reduction in uncertainty and pairs the chance of being wrong with the cost of being wrong as expected opportunity loss; the drop in that loss a measurement buys is the expected value of information. A real study removes part of the doubt, not all of it, so the expected opportunity loss is a ceiling on its value.
The quick test is the break-even doubt: the study cost divided by the cost of being wrong. If the team's honest doubt sits above it, fund the study; below it, build, or run a cheaper test. The dial uses the worked example's numbers from the next section.
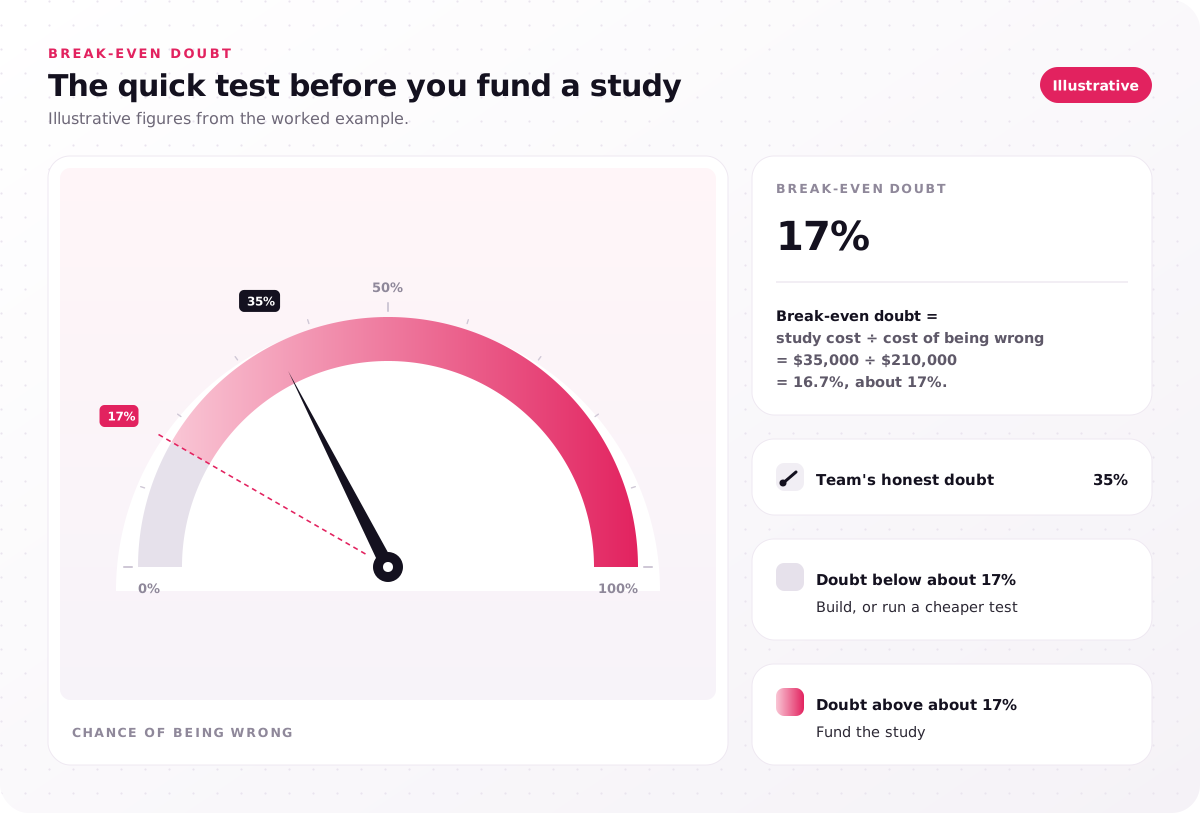
Illustrative figures from the worked example.
- Break-even doubt = study cost ÷ cost of being wrong = $35,000 ÷ $210,000 = 16.7%, about 17%.
- Team's honest doubt: 35%.
- Doubt below about 17%: build, or run a cheaper test.
- Doubt above about 17%: fund the study.
Doubt is the input teams shade down. In the Microsoft data, about two in three tested ideas failed to improve their target metric, so a team that calls itself 95% sure needs evidence for that 95%. Before you scope a study, ask what evidence sits behind that confidence, because a study aimed at one assumption costs less than a broad one, which lowers the break-even doubt. To match a method to that one assumption, see UX research methods matched to the question they answer.
UX ROI worked example, one feature bet and its study
In this illustrative UX ROI example, a $35,000 study against a $210,000 cost of being wrong breaks even at about 17% doubt, and the team's 35% makes it worth funding.
These figures are illustrative, chosen only to make the arithmetic visible, and none comes from a client project. A field-service app plans to build automatic job scheduling for dispatchers next quarter, a build stake of $300,000. The team judges that 70% of that work would be lost if dispatchers reject automatic schedules, a cost of being wrong of $210,000, and puts its chance of being wrong at 35% because no dispatcher has been interviewed yet.
The proposed study runs 12 dispatcher interviews in 1 user group, 5 contextual inquiry visits and a concept test over 5 weeks for $35,000, an illustrative price inside our published $25,000–$60,000 range, not a quote; the price drivers of a UX research program show what moves a study within it. The contextual inquiry visits mean watching dispatchers at work, a step our process for supply chain products also names, where researchers shadow pickers and dispatchers across shifts.
The expected opportunity loss is 0.35 × $210,000 = $73,500. The break-even doubt is $35,000 ÷ $210,000 = 16.7%, about 17%, well below the team's 35%. The expected return at funding is at most ($73,500 − $35,000) ÷ $35,000 = 110%, a ceiling, because the study will not remove all doubt.
At the readout, the last step of the program, one of three outcomes lands. In the change outcome, dispatchers distrust fully automatic schedules and want suggested slots they approve; the team re-scopes and estimates that $150,000 of planned work is avoided or redirected, a realized return of ($150,000 − $35,000) ÷ $35,000 = 329%.
A study that confirms the plan is not wasted money. In the go outcome the assumption holds and realized decision value is near zero, yet funding was still right, because the study's expected value was positive when the money was approved; like insurance on the build, the study is judged by the risk it covered. In the stop outcome, the problem proves too rare to justify a build, so the whole $210,000 loss is avoided.
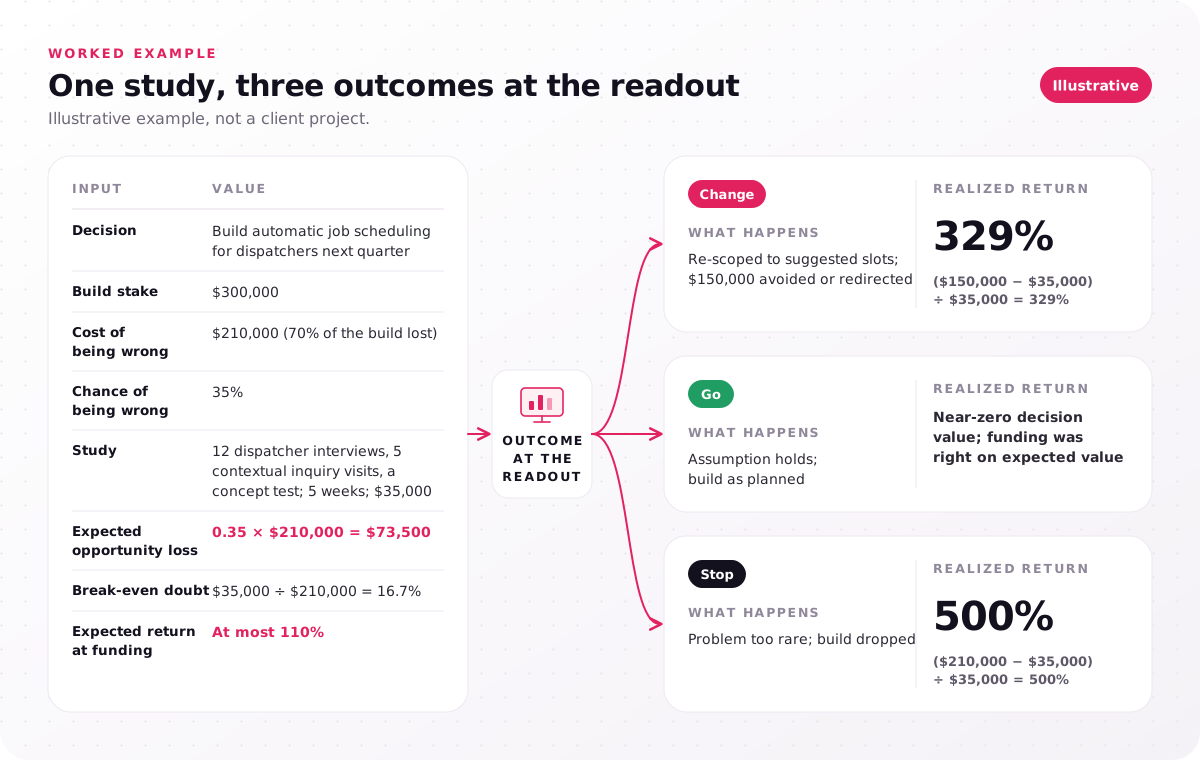
Illustrative example, not a client project.
| Input | Value |
|---|---|
| Decision | Build automatic job scheduling for dispatchers next quarter |
| Build stake | $300,000 |
| Cost of being wrong | $210,000 (70% of the build lost) |
| Chance of being wrong | 35% |
| Study | 12 dispatcher interviews, 5 contextual inquiry visits, a concept test; 5 weeks; $35,000 |
| Expected opportunity loss | 0.35 × $210,000 = $73,500 |
| Break-even doubt | $35,000 ÷ $210,000 = 16.7% |
| Expected return at funding | At most 110% |
Each outcome at the readout, priced against the $35,000 study.
| Outcome at the readout | What happens | Realized return |
|---|---|---|
| Change | Re-scoped to suggested slots; $150,000 avoided or redirected | ($150,000 − $35,000) ÷ $35,000 = 329% |
| Go | Assumption holds; build as planned | Near-zero decision value; funding was right on expected value |
| Stop | Problem too rare; build dropped | ($210,000 − $35,000) ÷ $35,000 = 500% |
Whichever outcome lands, the readout includes a Jobs to be Done (JTBD) opportunity map that ranks the dispatcher jobs by importance and current satisfaction. To reuse the example, swap in your own inputs and keep all three outcomes on the page, so nobody reads the result as a forecast of one.
What goes on a one-page UX ROI case for leadership?
A one-page UX ROI business case needs five lines, decision, stake, doubt, study and rule, showing leadership the cost of being wrong and what each finding does to the plan.
The page is a funding document, not a case study. Executives and other stakeholders asked to invest in UX research can check every figure on it, because each one comes from your own plan.
- Decision. What will be built, when, and who decides.
- Stake. The build stake and the cost of being wrong, with the share of work you expect to survive a change.
- Doubt. The chance of being wrong and the evidence behind it, or the absence of evidence.
- Study. Method, participants, weeks and price.
- Rule. The decision rule: which finding stops, changes or confirms the build, written before fieldwork.
The Rule line does the most work. A decision rule written before the first interview, such as "if fewer than X of 12 dispatchers accept automatic schedules, re-scope to suggested slots; if the problem shows up in fewer than Y of 5 visits, stop", makes the return measurable later and keeps the readout from being read to fit the plan. X and Y are the team's call. Keep the page to those lines and a sign-off, short enough for the executive suite to read in one sitting.
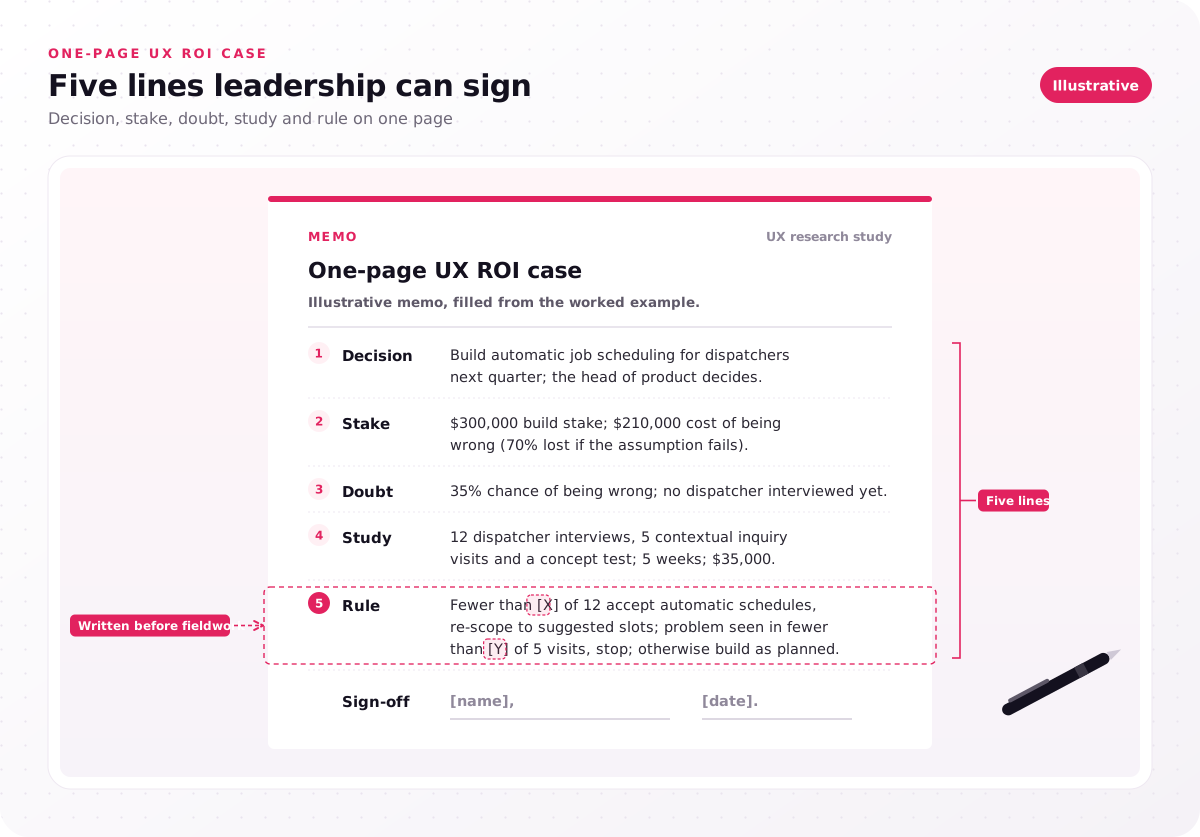
Illustrative memo, filled from the worked example.
- Decision: Build automatic job scheduling for dispatchers next quarter; the head of product decides.
- Stake: $300,000 build stake; $210,000 cost of being wrong (70% lost if the assumption fails).
- Doubt: 35% chance of being wrong; no dispatcher interviewed yet.
- Study: 12 dispatcher interviews, 5 contextual inquiry visits and a concept test; 5 weeks; $35,000.
- Rule: Fewer than [X] of 12 accept automatic schedules, re-scope to suggested slots; problem seen in fewer than [Y] of 5 visits, stop; otherwise build as planned.
- Sign-off: [name], [date].
A Study line that reads "to be confirmed" invites a no. A fixed-scope proposal replaces the placeholder with a defined scope, so draft the other four lines first and bring them to whoever scopes the study.
How do you measure UX ROI after the study?
Measure UX ROI after a UX research study with a decision log recording, per finding, the decision changed, the avoided cost or target metric, the attribution share and measurement window.
Decision value is counted at the readout, when the team records the build money it redirected. Improvement value waits until the changed design ships and its measurement window closes, because a time lag separates a decision from the metric it moves. Pick the one or two metrics the decision should move, such as task success rate, time on task, support tickets, churn rate or Net Promoter Score (NPS), and take a baseline before the change. Base any pre-launch projection on the study's findings, competitor benchmarks or past projects, and label it as one.
Attribution share is the part of a metric change the study can claim, agreed before launch, because pricing, marketing and other releases move the same metric. In the Parents Connect product revamp, research into what parents need from a community came first and the forum was designed from there; the case study reports 45% more forum participation among parents. That result belongs to the whole revamp, research and design together, so a decision log would credit the research with the direction it set, not with the percentage.
The log records each finding against the decision it changed and the evidence that will show its return.
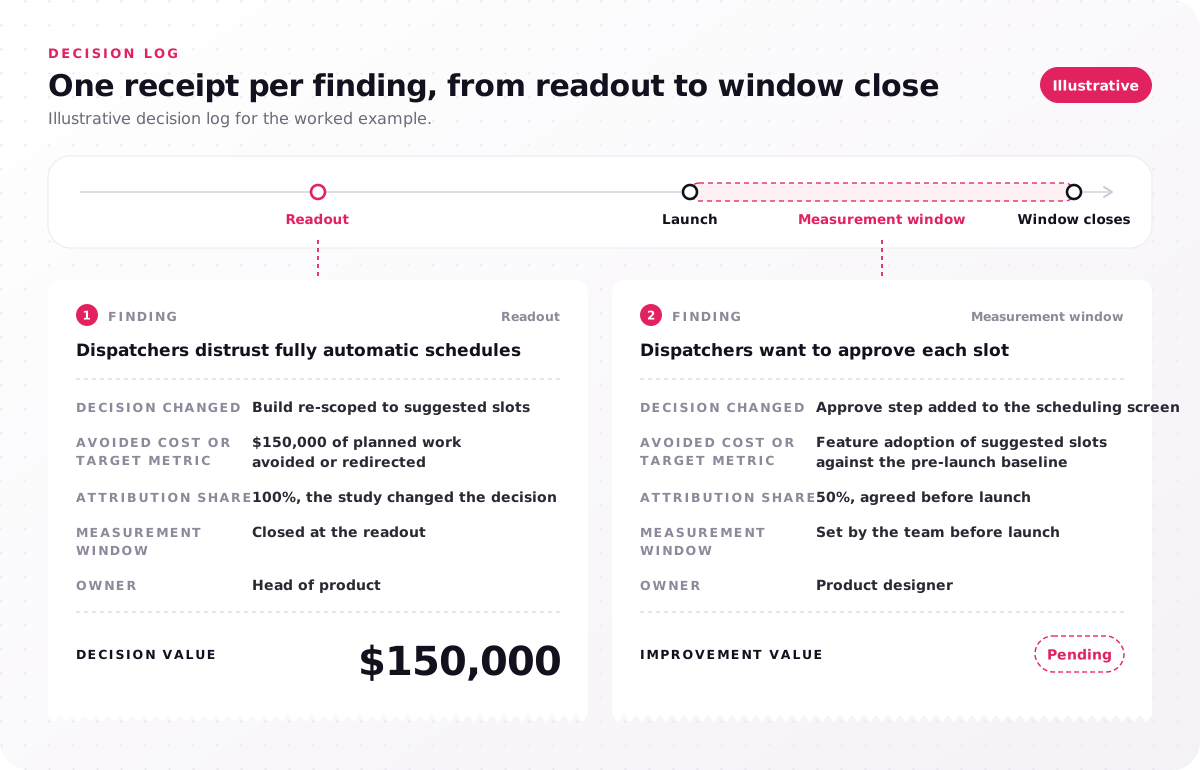
Illustrative decision log for the worked example.
| Finding | Decision changed | Avoided cost or target metric | Attribution share | Measurement window | Owner |
|---|---|---|---|---|---|
| Dispatchers distrust fully automatic schedules | Build re-scoped to suggested slots | $150,000 of planned work avoided or redirected | 100%, the study changed the decision | Closed at the readout | Head of product |
| Dispatchers want to approve each slot | Approve step added to the scheduling screen | Feature adoption of suggested slots against the pre-launch baseline | 50%, agreed before launch | Set by the team before launch | Product designer |
To report UX research ROI across several studies, total the decision log each quarter and keep decision value and improvement value on separate lines, so a strong launch does not hide a study that changed nothing. Open the log at your next readout and test each finding against the decision rule from your one-page business case.
When does a UX research study have a negative ROI?
A UX research study earns a negative UX ROI when its price exceeds the expected opportunity loss: a small build stake, a reversible change, low doubt or a known answer.
- A small build stake. When the cost of being wrong is close to the study cost, the break-even doubt nears 100%, so no honest doubt clears it.
- A change you can reverse on live traffic. A/B testing measures a variant's result on real users directly, so a wrong version costs a rollback, not a rebuild.
- Low doubt with evidence behind it. When an earlier study already tested the assumption, the honest doubt falls below the break-even doubt.
- An answer already in the research repository. Searching tagged findings costs hours, not a program, which is reuse value paying out.
Is the ROI of UX declining? Yes, in Jakob Nielsen's view. In his 2025 UX Tigers essay Declining ROI From UX Design Work, he argues that returns from UX design work have fallen since about 2020, because the low-hanging fruit of terrible usability has long since been picked. Read that as a reason to aim studies at uncertain, expensive decisions.
When price is the only problem, shrink the study before you skip it. A narrower study, such as the 8–10 user interviews we suggest for a startup, lowers the study cost and the break-even doubt with it, so run the sum again at the smaller price.
Who owns the UX ROI case, and when does outside help pay?
The decision's product owner builds the UX ROI business case, since only they know the build stake and doubt; a UX research partner pays when the study outgrows your team.
A researcher can run the arithmetic, but the stake comes from the build plan and the doubt from the people who wrote it, so the owner signs the business case. Outside help pays when the study, not the sum, is the hard part, and three of the five lines show it:
- The Doubt line rests on users nobody on the team can reach. If the study never hears from the people able to prove the assumption wrong, the chance of being wrong stays where it was; recruiting is its own step in our program, 3–6 days before fieldwork.
- The Study line combines methods your team cannot run together. Interviews, field visits and a concept test feeding one decision rule have to become one answer at the readout, and that synthesis needs someone who has run all three.
- The Rule line belongs to a sponsor who also wrote the plan. When the person setting X and Y wants the build, leadership discounts the readout, and a team that did not write the plan keeps the decision rule credible.
Our UX research program runs 4–8 weeks at $25,000–$60,000, with 10–15 interviews per user group, and ends in a 90-minute readout. If no decision is framed yet, a UX consulting engagement gives senior guidance in 2–3 weeks for $5,000–$15,000.
The same scheduling build can flip on doubt alone. At 35% doubt it justifies the $35,000 study; at 10% doubt the expected opportunity loss falls to 0.10 × $210,000 = $21,000, below the study price, so the team builds or runs a cheaper test. Price the next build on your roadmap the same way, and if its Study line still has no scope, bring the decision and the budget riding on it to a scoping call. Every project begins with a free consultation and a fixed-scope proposal.
FAQs
Is UI/UX worth it in 2026, or is the field oversaturated?
Yes, where a decision is uncertain and expensive. "Oversaturated" usually describes a crowded job market for user interface (UI) and UX designers, which does not change whether a study pays for your product. With design returns falling, the return sits in decisions with a large cost of being wrong, so run the break-even doubt test before each study.
Will AI replace UX research and its ROI?
No. Artificial intelligence (AI) speeds up the cheap parts of a study, such as writing a discussion guide or turning recordings into transcripts and summaries, which trims the study cost. It cannot lower the chance of being wrong about your users, because a model holds no evidence from them; NN/g's 2024 review of synthetic users by Maria Rosala and Kate Moran finds such output useful for generating hypotheses but not for final decisions.
How long does UX research take to show ROI?
Decision value shows at the readout, the end of a 4–8 week program, when the build is stopped, changed or confirmed. Improvement value appears only after the changed design ships and the measurement window your team set before launch has closed.
Is the ROI of UX research different from the ROI of UX design?
Yes. The ROI of UX design measures what a better interface earns or saves after it ships, through checkout conversion, retention or support cost savings. The ROI of UX research mostly measures decisions changed before the build, plus the design improvements those decisions lead to, so report the two on separate lines.
Can you calculate UX ROI with a free calculator?
Yes, for a rough estimate. An online UX ROI calculator multiplies the figures you type in, so its UX ROI estimates are only as good as the stake, doubt and baseline you supply; fill the five-line business case first.