3–5 days
Decision discovery
We interview 5–8 users per role and list decisions, data sources and workarounds as Jobs to be Done.

We design dashboards around the decisions users make, with the right hierarchy, drill-downs, and alerts, instead of every metric at once.





Get a free consultation
Free consultation · reply within one business day
In shortDashboard UX design structures the information hierarchy, decision workflows and alerts of a dashboard, so each user role sees the key performance indicators (KPIs) behind the decisions that role makes. Our dashboard UX design takes 4–8 weeks, costs $25,000–$60,000, and ends with tested role-based views and drill-down paths.
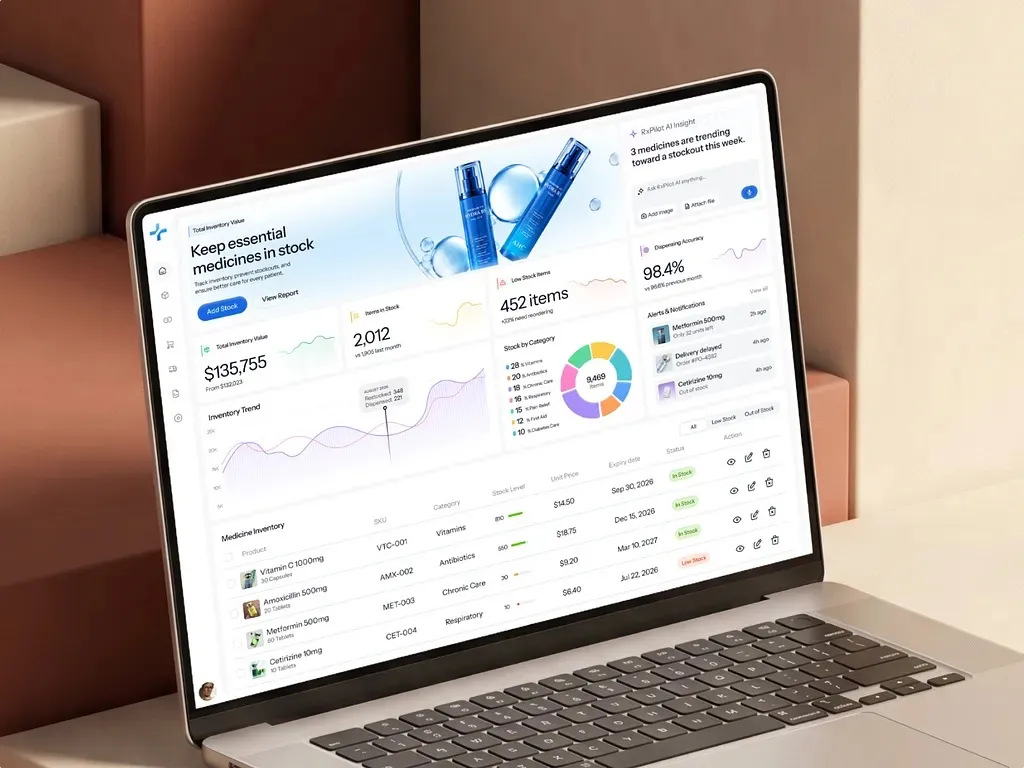
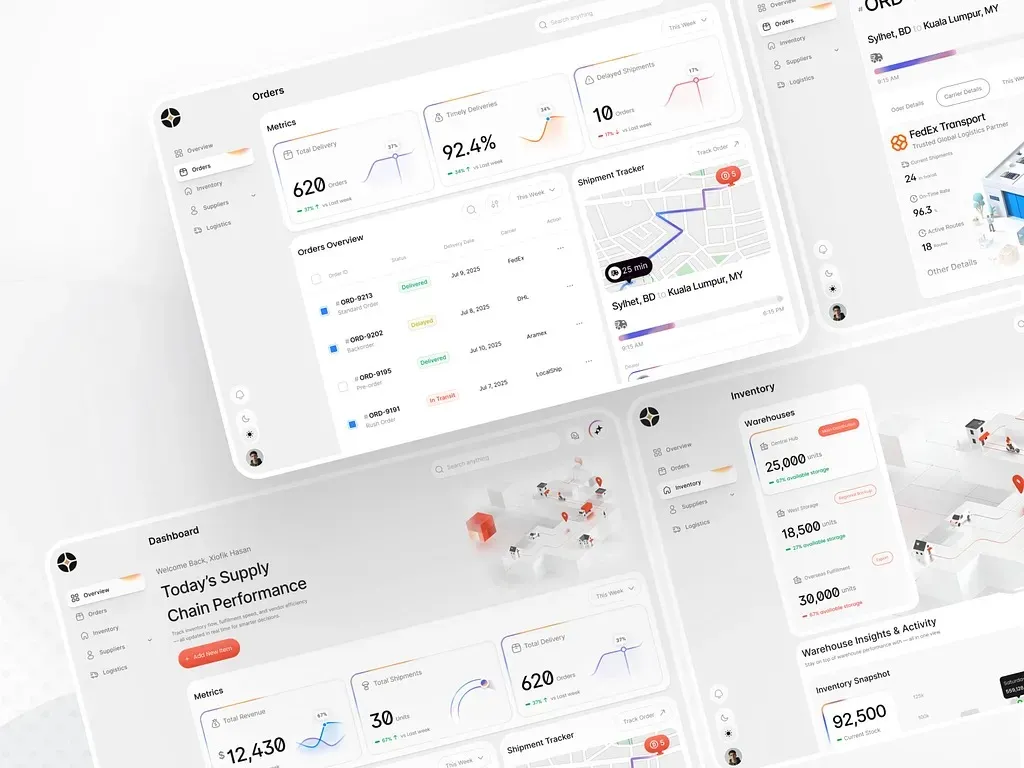
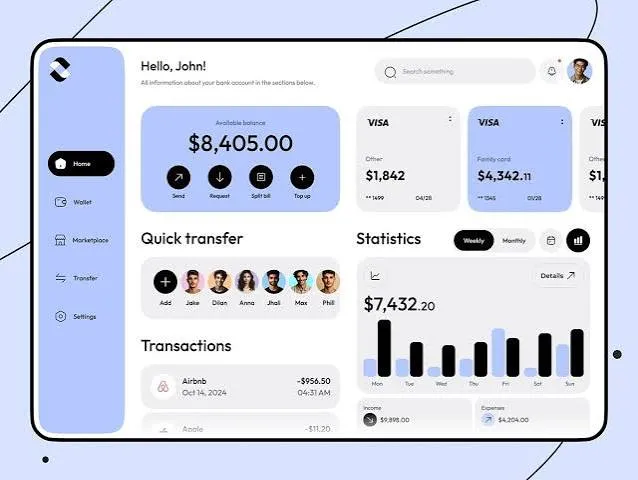
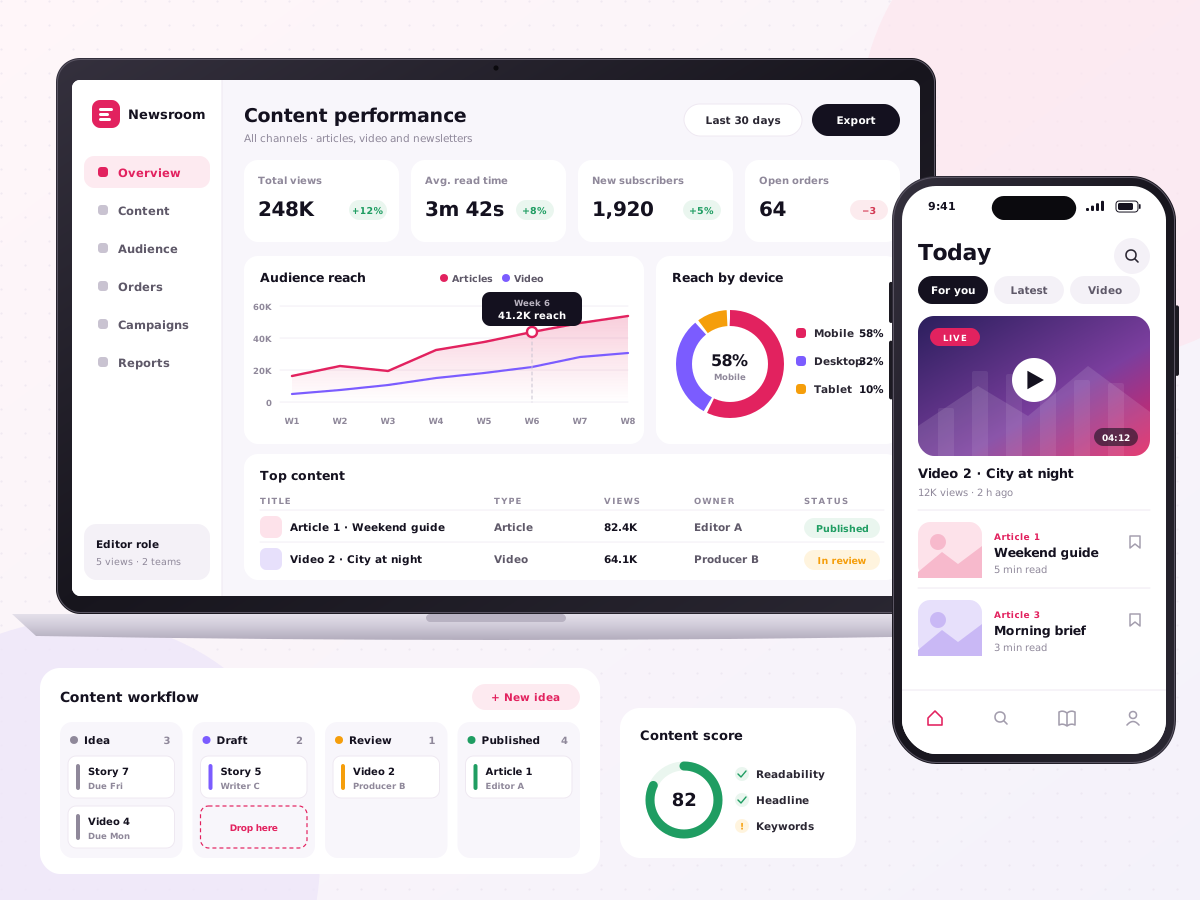
Dashboard UX design is the user experience (UX) design of a dashboard: the choice of metrics, the hierarchy of metrics and the path from a number to an action. Designers start from the decisions each role makes, for example approving orders or escalating incidents, and remove metrics no decision needs.
Dashboard UX design sets the structure, and dashboard design services set the visual layer, for example chart styles and component kits. A KPI dashboard with a clear dashboard information architecture shows 5–7 metrics per view, with a drill-down path to the detail behind each metric. Our guide to dashboard design principles sets out the six rules in the order teams apply them, from the decision to alert states.
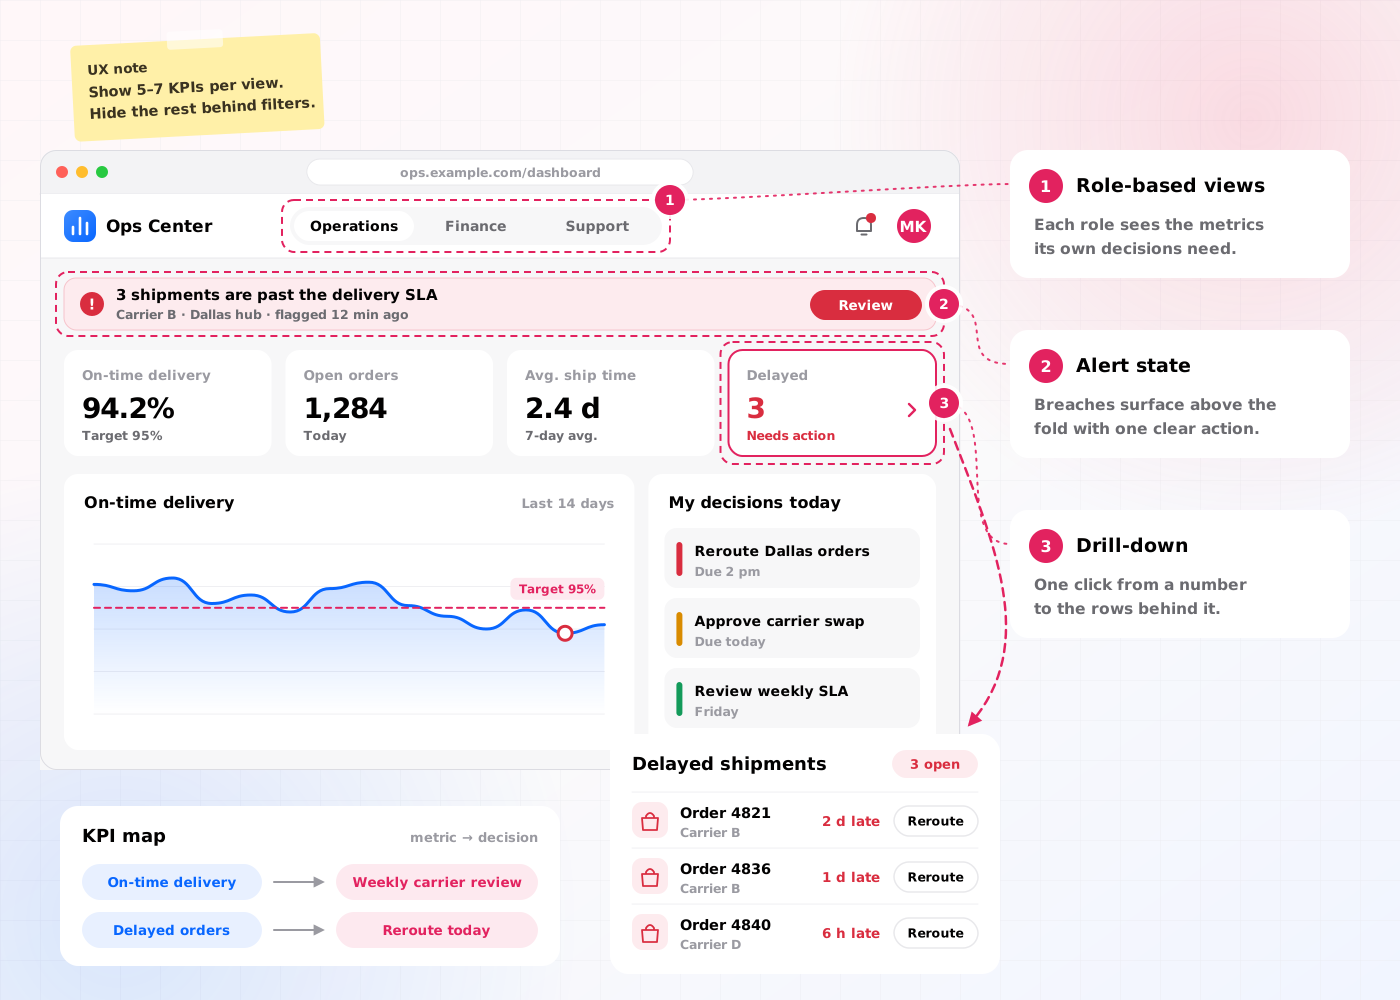
Our dashboard UX design includes 6 deliverables: a decision inventory, a KPI map, a dashboard information architecture, role-based views, an alerting model and a tested prototype.
A list of the decisions each user role makes, for example daily stock reorders or weekly budget reviews.
Every metric linked to one decision and one data source, for example on-time delivery rate linked to the weekly carrier review.
The hierarchy of overview, summary and detail levels, for example 1 overview screen with 3 drill-down levels.
Separate views per role built on role-based access control, for example an executive view and an analyst view.
Thresholds, alert states and notification rules, for example a red state when stock falls below 2 days of cover.
A clickable Figma prototype tested with 5 users per role, for example a 5-task decision test in Maze.
The dashboard UX design process takes 4–8 weeks (20–40 working days) and runs in 5 steps, from decision discovery to handoff.
We interview 5–8 users per role and list decisions, data sources and workarounds as Jobs to be Done.
Designers map each KPI to a decision and structure the overview, summary and detail levels.
Designers wireframe drill-down paths, filters and alert states for each role-based view.
Users from each role complete 5 decision tasks in a Figma prototype, and designers fix every failed task.
We hand over the information architecture, annotated wireframes and alert rules to the visual design and engineering teams.
Dashboard UX design has 4 benefits: it increases dashboard adoption, improves decision-making, reduces time to find data and develops shared KPI definitions.
Views built around each role's decisions increase the share of users who open the dashboard every week.
A clear information hierarchy puts the metric behind each decision first, so users act on the right number.
Drill-down paths and saved filters reduce the clicks between an alert and the record behind the alert.
The KPI map develops one definition per metric across product, operations and finance teams.
Dashboard UX design decides what a dashboard shows and for whom; dashboard design services decide how the dashboard looks and how developers build the dashboard. Most teams run dashboard UX design first.
| Criterion | Dashboard UX design | Dashboard design services |
|---|---|---|
| Focus | Metrics, hierarchy, workflows and alerts | Layout, chart styles, colour and components |
| Main output | Dashboard information architecture and tested prototype | High-fidelity screens and a component kit |
| Key question | Which decision does each view support? | Which chart shows each metric clearly? |
| Timeline | 4–8 weeks | 4–8 weeks |
| Price on this site | $25,000–$60,000 | $25,000–$60,000 |
Dashboard UX design costs $25,000–$60,000 and takes 4–8 weeks. The price depends on 4 factors: the number of user roles, the number of KPIs, the number of data sources and the number of test rounds.
A single-role KPI dashboard with 10–15 metrics and 1 test round sits near $25,000. A multi-role operations dashboard with 4 role-based views, an alerting model and 3 test rounds sits near $60,000. Dashboards inside a larger product continue with web app design services.
An operations team needs dashboard UX design in 5 situations:
Book a 45-minute UX audit session. We review your product and identify the top three friction points.
Book a UX auditWe design UI and UX for SaaS, Supply chain, Finance, Media, Blockchain, AI and Enterprise products.
Send us your project. A design lead reviews it and schedules a call within one business day. We sign an NDA before the first technical discussion if you prefer.
These answers cover the 5 questions buyers ask most about dashboard UX design.
Still have a question?
A design lead answers every message within one business day.
Talk to a design leadNo. Dashboard UX design sets metrics, hierarchy and workflows, while dashboard visual design sets colours, chart styles and components.
Yes. Dashboard UX design works for Power BI, Tableau and Looker dashboards, and for custom dashboards built in code.
Yes. Dashboard UX design includes an alerting model with thresholds, alert states and notification rules for each user role.
No. Every user role needs a role-based view, because an executive and an analyst make different decisions with different metrics.
Dashboard UX design takes 4–8 weeks, which equals 20–40 working days, from decision discovery to handoff.