Key takeaways
- Settle the decision each user role makes before choosing metrics, because the decision decides which numbers belong on a view.
- Keep each view to 5–7 metrics, and show every metric beside a target, a prior period or a benchmark.
- People compare values most accurately by position and length, so bars, lines and dots carry numbers while color flags status.
- The dashboard 5-second rule is a heuristic adapted from the five-second test, a target to test with users rather than a measured law.
- A view passes testing when users from each role name the primary metric and its status after five seconds and finish each decision task unaided.
Dashboard design principles exist to end rituals like this one: every Monday, the operations manager of a city bike-share network exports her dashboard to a spreadsheet, because no view tells her which stations need a morning restock run this week. The export is the symptom; the cause is a dashboard built from the data the team had instead of from her decision. The manager and the network are made up for this article.
Six principles fix that, applied in order: build each view around one decision, keep only the metrics it needs, rank them so the main number reads in five seconds, encode values with length and position, design alert and stale states, and keep patterns consistent. Four of them set user experience (UX) structure rather than looks. Dashboard UX design settles that structure before the visual layer, and each principle comes with a pass mark you can test.
What are dashboard design principles?
Dashboard design principles are the rules that decide what a dashboard shows, for which user role and decision, in what order, and how a user acts on it.
Most principles of dashboard design come from perception research, which explains how people read charts, and from dashboard practice. Stephen Few, in Information Dashboard Design (2006), describes a dashboard as the most important information needed for one or more objectives, arranged on a single screen so it can be monitored at a glance. Juice Analytics, in its essay "Breaking Free of the One-Page Dashboard Rule", argues that the one-screen limit crams information together and leaves no room to show how the numbers connect. This guide keeps the at-a-glance goal for each view.
Most lists of dashboard design best practices mix two layers: what to show (decision-first scope, metric selection, information hierarchy, alerts) and how it looks (visual encoding, color). Settle the structure first, because no chart style rescues a view that answers the wrong question. The stack orders the six dashboard design principles so each rests on the one beneath it.
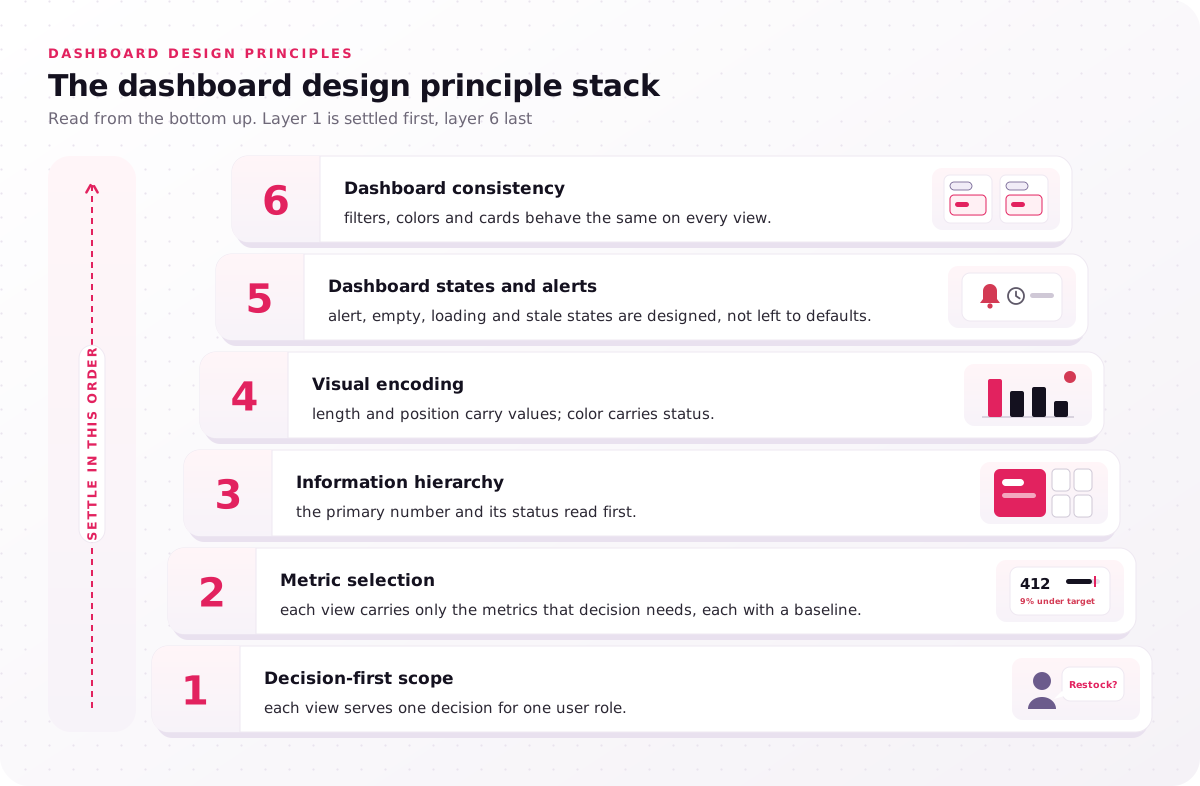
- Decision-first scope: each view serves one decision for one user role.
- Metric selection: each view carries only the metrics that decision needs, each with a baseline.
- Information hierarchy: the primary number and its status read first.
- Visual encoding: length and position carry values; color carries status.
- Dashboard states and alerts: alert, empty, loading and stale states are designed, not left to defaults.
- Dashboard consistency: filters, colors and cards behave the same on every view.
List your dashboard's views and mark which of the six each one already meets.
What are the 5 basic principles of design?
In general graphic design, the five basic principles are commonly taught as balance, contrast, alignment, repetition and proximity, though the list varies by textbook.
On a dashboard, contrast makes the primary metric stand out, and proximity places related key performance indicators (KPIs) side by side so users read them as one group. Treat the general list as craft, and the dashboard design principles here as the rules that decide content.
What are the four main types of dashboards?
The four main types of dashboards are operational, strategic, analytical and tactical, and the dashboard type sets which principles weigh most for each decision owner.
- Operational dashboard: a real-time or hourly refresh interval for operators who act within minutes, so alert states matter most.
- Strategic dashboard: a weekly or monthly refresh for executives who set direction, so targets and trends matter most.
- Analytical dashboard: a daily refresh for analysts who look for causes, so drill-down depth and filters matter most.
- Tactical dashboard: a daily or weekly refresh for managers who track a plan, so comparison baselines matter most.
A typical operational dashboard is the dock view in supply chain UX design, where supervisors watch trucks waiting and orders at risk of missing carrier cut-off on a wall display. The split is a convention, not a standard, so vendor lists differ; name the type of each view before you design it.
Principle 1, design each dashboard view around one decision
The first dashboard design principle is to start from the decision a user role makes, not from the data the team happens to have.
A view that answers one decision, such as "which stations get a restock run?", tells you which metrics belong on it. The working document for this decision-first scope is a decision inventory, with one row per decision. The table lists three roles in the illustrative bike-share network and the decision each one owns.
| Decision owner | Decision | Cadence | Metric | Alert threshold |
|---|---|---|---|---|
| Operations manager | Which stations get a morning restock run this week | Weekly | Empty-station hours per station, last 4 weeks | Over 10 empty hours in a week |
| Van crew lead (operator) | Which station to restock next | Real time | Bikes available against forecast demand | Under 2 hours of cover |
| Finance director (executive) | Whether to fund new stations | Quarterly | Rides per bike per day against target | Below target 2 quarters running |
Each row becomes one of the role-based views, also called role-specific views, because the finance director and the van crew lead never share a cadence. User personas are a fair starting point, but a persona describes a person and the inventory describes a decision. TradeZella's mentor mode shows the idea in a shipped product: it "lets a coach follow each mentee's cumulative P&L [profit and loss] side by side", a view built for the coach's decision. The Anyday App case study splits views the same way, with a business dashboard for employers and a separate dashboard where merchants track their transactions.
Teams skip the inventory because it produces no screens, yet it decides every screen. Our process opens with decision discovery, 3–5 days in which we interview 5–8 users per role, and that step feeds the decision inventory and KPI map we deliver. Start yours with one row per meeting where someone reads the dashboard.
What should an executive dashboard look like?
An executive dashboard should show a few metrics tied to strategic goals, each with a target and a trend, plus a path to the detail an analyst owns.
Executives decide on direction and funding, so the view answers "are we on track, and where not?" rather than "why?". The illustrative finance director's view leads with rides per bike per day against target, and one click opens the analyst's station breakdown. List your executive's three recurring decisions before you pick a chart.
Principle 2, limit each dashboard view to 5–7 metrics
The second dashboard design principle keeps each view to 5–7 metrics, each linked to a decision and shown with a comparison baseline.
That count of metrics per view is our working range, not a research finding, and the detail behind each metric sits one drill-down level lower. Simplicity means fewer numbers on screen, not fewer facts in the product. A number without a target, prior period or benchmark says nothing about whether to act: in the bike-share example, "412 rides" asks nothing, while "412 rides, 9% under target" asks for a decision.
Metric selection runs on one cut test: which decision changes if this number moves? No answer, no place on the view. The survivors go into a KPI map, which links every KPI to one decision and one data source, so two teams stop reporting different numbers for the same KPI.
Effective use of language finishes the step. Label each metric with what it counts, its unit and its time window ("Empty-station hours, last 7 days"), never a code such as "ESH_7D", because a new user has no context to decode it. Run the cut test on your busiest view and count what survives.
Principle 3, pass the 5-second rule with dashboard hierarchy
Information hierarchy, the third of these dashboard design rules, ranks the numbers so each user role grasps a view's main status within about five seconds.
Make the number behind the most frequent decision the largest element and put it where the eye lands first; that is visual hierarchy applied to data. Tableau's dashboard guidance says most viewers scan from the top left and advises placing the most important view in the upper-left corner, and Microsoft's Power BI dashboard tips give the same advice for business intelligence (BI) dashboards. Eye-tracking studies by Nielsen Norman Group (NN/g) found an F-pattern on text-heavy pages, so keep critical numbers off the far right of lower rows.
Gestalt principles handle grouping: proximity and a shared card tell users which KPI cards belong together, and similarity marks peers. Use white space to separate groups, not as decoration, and a grid layout to keep them aligned.
Progressive disclosure keeps the hierarchy shallow: overview, summary and detail levels, with a drill-down path from every number to the record behind it. If users need a drill-down depth beyond three levels, check whether the overview is doing an analyst's job.
What is the 5-second rule for dashboards?
The 5-second rule for dashboards says a user should tell, within about five seconds of a glance, what the dashboard covers and whether anything needs action.
It adapts the five-second test, a UX research method Paul Doncaster documented in The UX Five-Second Rules (Morgan Kaufmann, 2014): show a design for five seconds, hide it, then ask what people recall. No primary study fixes five seconds as the right glance time for dashboards, and dashboard UX best practices like this one count only once users pass them.
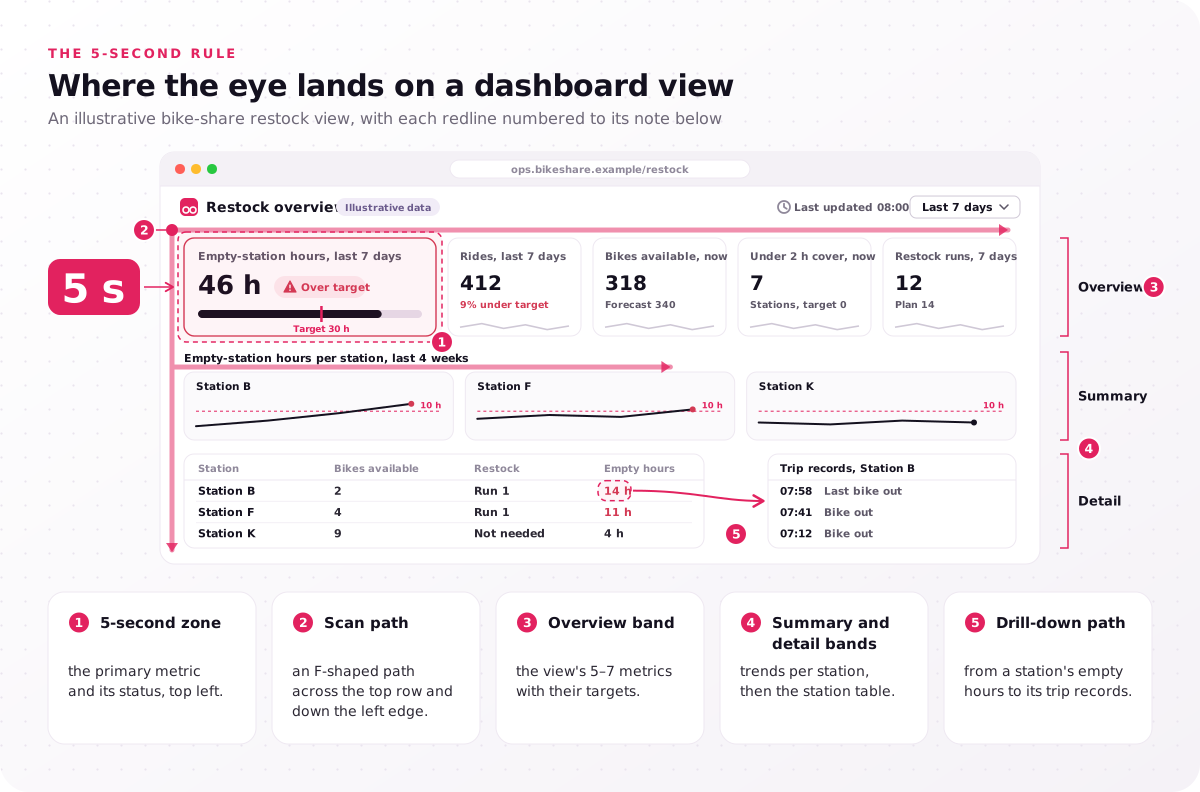
- 5-second zone: the primary metric and its status, top left.
- Scan path: an F-shaped path across the top row and down the left edge.
- Overview band: the view's 5–7 metrics with their targets.
- Summary and detail bands: trends per station, then the station table.
- Drill-down path: from a station's empty hours to its trip records.
Sketch your view and circle what must be seen in five seconds; more than one circled number means the hierarchy is not settled.
Principle 4, encode dashboard numbers by length and position
Under this dashboard design principle, numbers go into bars, lines and dots, because every user role compares length and position most accurately, while color flags status.
Visual encoding is the mapping from a number to a visual property such as position, length, angle or color. In "Graphical Perception" (Journal of the American Statistical Association, 1984), William Cleveland and Robert McGill ranked how accurately people judge those properties, with position along a common scale first and shading and color saturation last. In its dashboard chart guidance, NN/g names length and 2D position as preattentive attributes, features the eye registers before focused attention, that people read quickly and accurately. Pie charts, gauges and treemaps rely on angle or area, so readers compare them less accurately; Microsoft's tips do recommend gauge charts for a current value against a goal, and a bullet chart shows the same comparison as length.
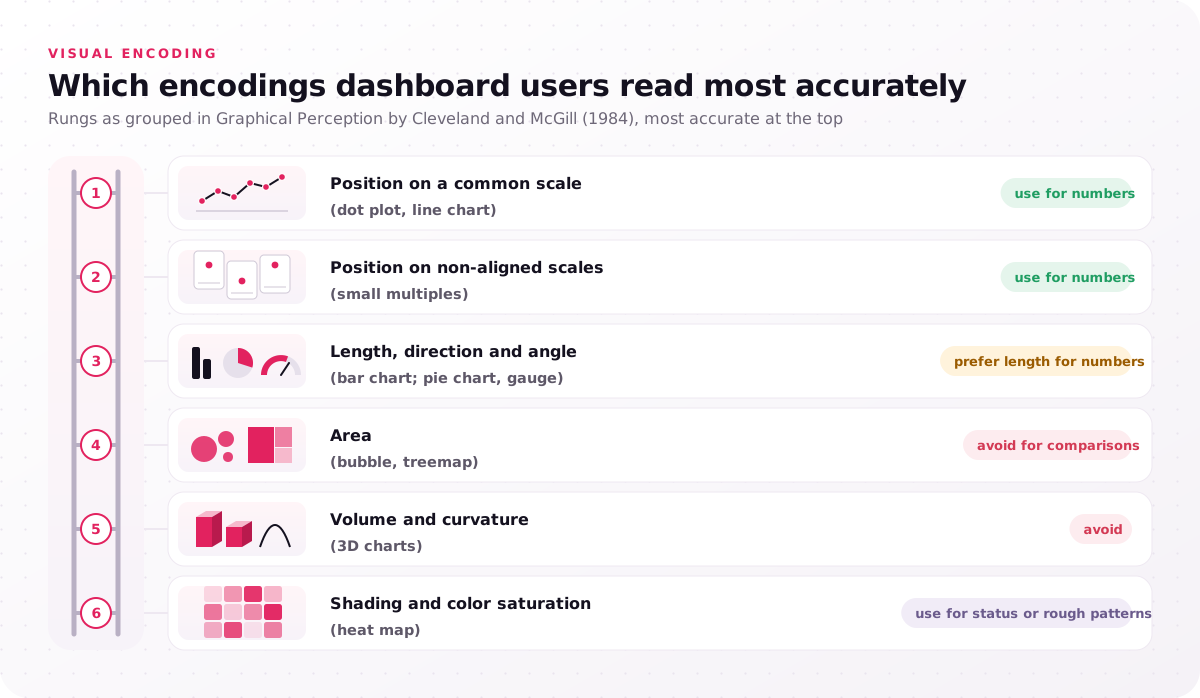
- Position on a common scale (dot plot, line chart): use for numbers.
- Position on non-aligned scales (small multiples): use for numbers.
- Length, direction and angle (bar chart; pie chart, gauge): prefer length for numbers.
- Area (bubble, treemap): avoid for comparisons.
- Volume and curvature (3D charts): avoid.
- Shading and color saturation (heat map): use for status or rough patterns.
The table matches the question a metric answers to the chart type that answers it with position or length.
| Question the metric answers | Chart type | Why it reads well |
|---|---|---|
| How has it moved over time? | Line chart | Position along a common scale |
| Which items are higher or lower? | Sorted bar chart | Length from a shared baseline |
| How do 2–4 parts make up the whole? | Stacked bar | Length, with the key part on the baseline |
| Is one value on target? | Bullet chart | Length against a target mark |
| How are values spread? | Histogram | Bar length on a shared axis |
For the visual layer, a chart selection guide and data color palette are two deliverables of our dashboard design services: the guide holds that rule (line charts for trends, bar charts for comparisons), and the palette sets the categorical, sequential and status colors.
Color belongs to status, not size. Keep the color palette small and the number of colors low, use one status scale everywhere, and never let red against green carry meaning alone: Web Content Accessibility Guidelines version 2.2 (WCAG 2.2) says, in its Use of Color criterion, that color must not be the only visual means of conveying information. Its non-text contrast criterion asks for a contrast ratio of at least 3:1 against adjacent colors for graphical objects users need, such as chart lines and status marks. For trading tables, our financial dashboard design approach pairs every gain or loss color with a +/− sign.
Edward Tufte's data-ink ratio, from The Visual Display of Quantitative Information, says most of a chart's ink should show data, so cut 3D effects, heavy gridlines and decoration. Swap one gauge for a bullet chart and time how fast a colleague reads it.
Principle 5, design dashboard states, alerts and freshness
The fifth dashboard design principle gives every view designed alert, empty, loading and stale states, because a user role decides differently when a number is late or missing.
Dashboard states and alerts start from the alert threshold value: the number that switches a metric into an alert state, set per metric and per role. In the illustrative network, a station turns red for the van crew lead below 2 hours of cover, while the operations manager sees only the weekly pattern. Rank alerts into a few priority levels, because when every alert has the same priority operators learn to ignore them all, a pattern NN/g's video "Alert Fatigue in User Interfaces" covers for dashboards.
An empty state explains why no data shows yet, a loading state holds the card at its final size, and an error state names what failed. Data freshness needs its own signal: put a "last updated" time and the refresh interval beside the numbers they qualify. Our alerting model writes the alert thresholds, alert states and notification rules down for each role.
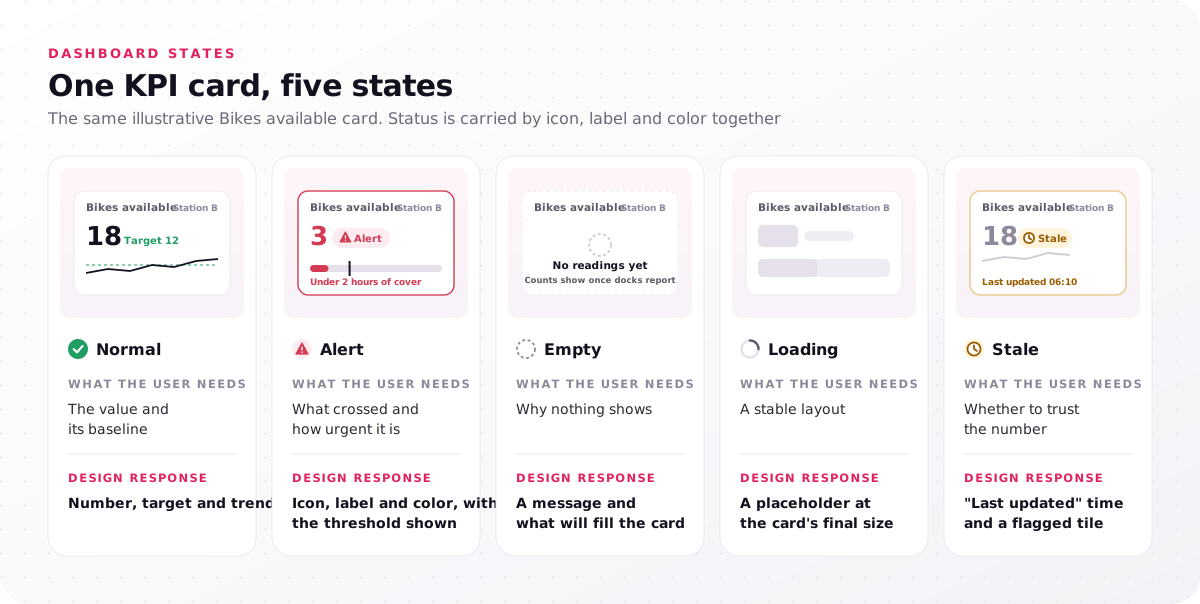
| State | What the user needs | Design response |
|---|---|---|
| Normal | The value and its baseline | Number, target and trend |
| Alert | What crossed and how urgent it is | Icon, label and color, with the threshold shown |
| Empty | Why nothing shows | A message and what will fill the card |
| Loading | A stable layout | A placeholder at the card's final size |
| Stale | Whether to trust the number | "Last updated" time and a flagged tile |
List the states each card on your dashboard has today, and fix first any card that has only its normal state.
Principle 6, keep dashboard patterns consistent across tools
The sixth principle, dashboard consistency, means a filter, color or KPI card behaves the same on every view, so each user role learns the dashboard once.
Visual consistency covers status colors and card styles; efficient interactions cover the same filter position, date control and drill-down gesture everywhere. A filter that resets between views makes users rebuild their context on every click. On BI canvases, limit the number of views and colors per dashboard; Tableau's guidance suggests about two or three views.
The principles hold in every BI tool, but each tool limits layout and color control its own way. The table compares where three common tools set those limits, based on each vendor's documentation.
| Tool | How layout is built | Where consistency is set |
|---|---|---|
| Power BI | Report pages on a canvas; dashboards pin tiles | Report theme files for colors and text styles |
| Tableau | Dashboard objects, tiled or floating, grouped in layout containers | Workbook formatting, plus device layouts for phones |
| Looker | Dashboards built from tiles | Fields defined once in LookML |
Tableau and Microsoft publish their own dashboard best practices, and both start where principle 1 does: know the audience and purpose. Microsoft's Power BI tips add that a large monitor holds more than a phone, and the service lets authors build a separate phone view of a dashboard. The single-screen ideal bends on a phone; the order of priorities does not.
What are the top 5 dashboard tools?
No official top 5 ranking of dashboard tools exists; five BI tools that teams build dashboards in are Microsoft Power BI, Tableau, Looker, Qlik Sense and Looker Studio.
These dashboard design principles apply in all five, because they decide content and order before any tool renders a chart. Our dashboard work covers the first three of these tools and custom dashboards your engineers build in code, so pick the tool after the decision inventory, not before.
Which dashboard design principles do teams break most?
In our view, the dashboard design principles teams break most often are the first two: building views from available data instead of a decision, and showing every metric at once.
Visual mistakes such as pie charts, rainbow palettes and 3D effects are easier to spot and cheaper to fix, because they leave the structure alone. Each common mistake maps to the principle it breaks:
- One dashboard for every role breaks principle 1, because an executive and an operator make different decisions.
- Metrics without baselines break principle 2, because a bare number never says whether to act.
- Twenty tiles of equal size break principle 3, because nothing reads first.
- Gauges for every metric break principle 4, because angle reads less accurately than length.
- Red and green as the only status cue break principle 4, because users with color vision deficiency lose the signal.
- No stale-data signal breaks principle 5, because users act on old numbers without knowing it.
- Filters that reset between views break principle 6, because users rebuild context on every click.
TradeZella's case study names the structural version of the problem: "a complex, cluttered interface that buried the numbers traders care about." Clutter like that fails principles 2 and 3 first, and styling second.
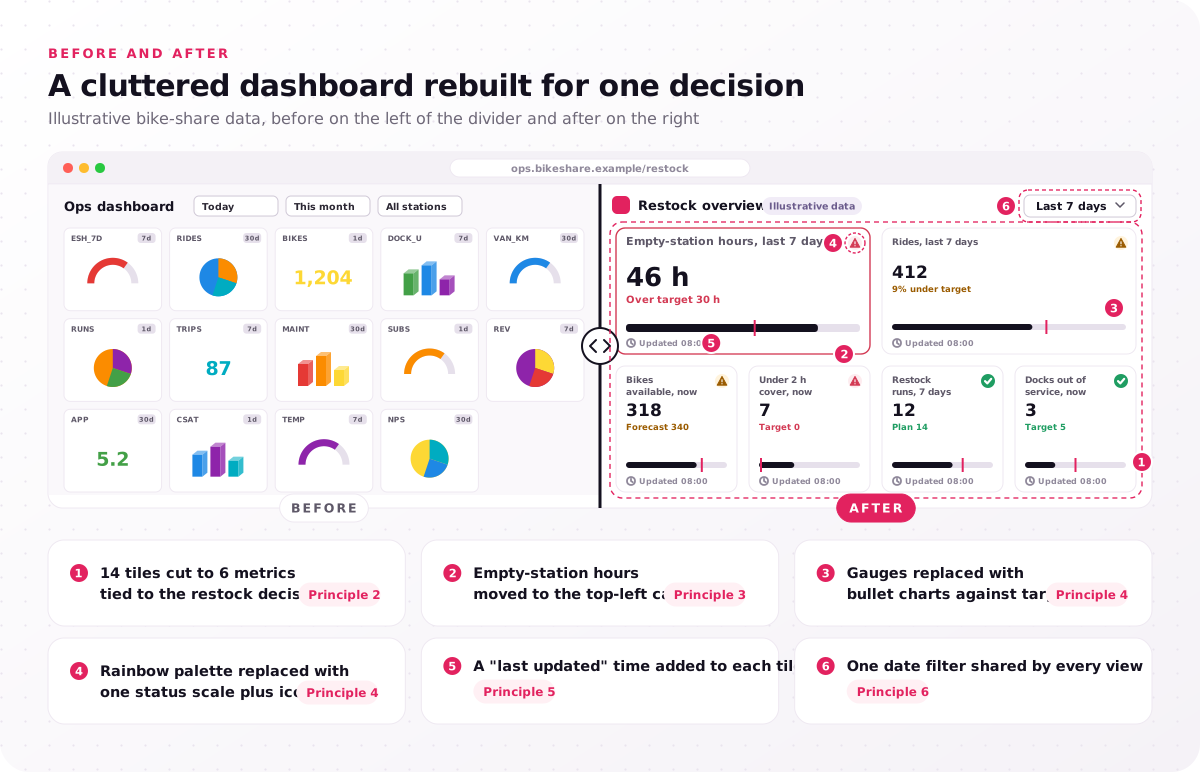
- 14 tiles cut to 6 metrics tied to the restock decision (principle 2).
- Empty-station hours moved to the top-left card (principle 3).
- Gauges replaced with bullet charts against target (principle 4).
- Rainbow palette replaced with one status scale plus icons (principle 4).
- A "last updated" time added to each tile (principle 5).
- One date filter shared by every view (principle 6).
Mark the lowest-numbered principle your dashboard breaks, and fix that one first.
How do you test dashboard design principles with users?
Test dashboard design principles with real users from each role: a five-second test for hierarchy, then decision tasks in a clickable prototype for everything else.
A view passes the five-second test when users name the primary metric and its status after seeing it for five seconds. In our prototype testing step, users from each role complete 5 decision tasks in a Figma prototype, 5 users per role, and designers fix every failed task. Maze runs such tests unmoderated, and the decision task pass rate, tasks finished without help divided by tasks attempted, is the number to track per role.
After launch, Hotjar session recordings and heatmaps show whether the tested hierarchy holds on real data. The review sheet turns each principle into two pass-or-fail checks.
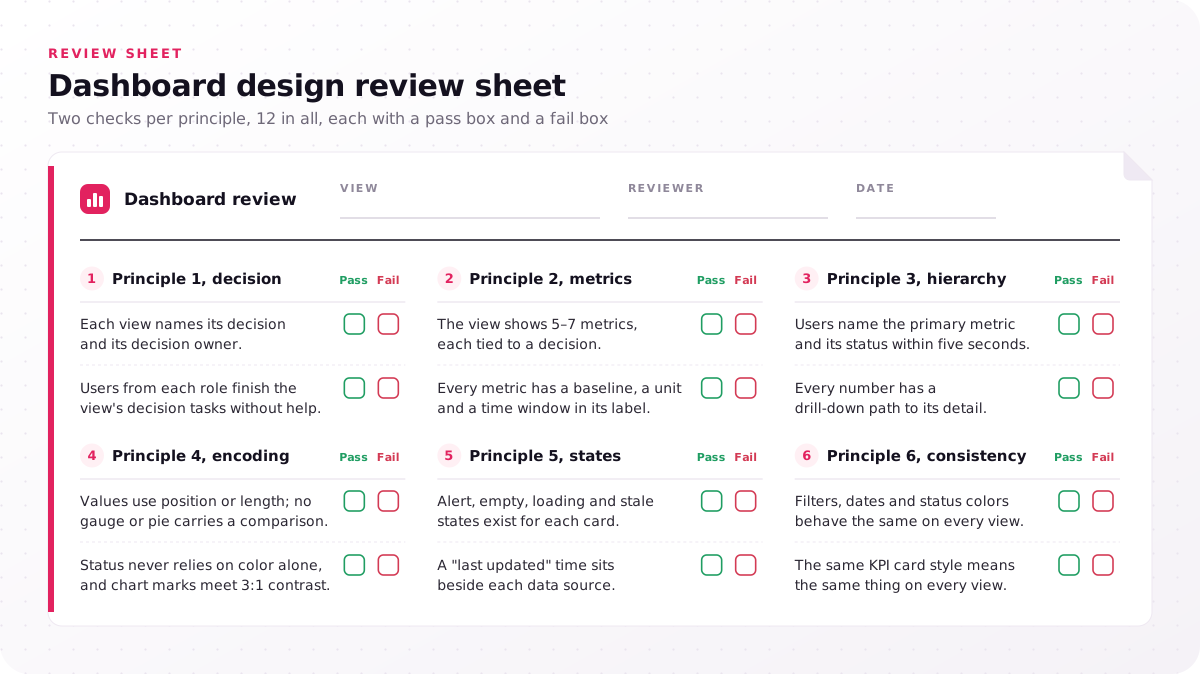
Principle 1, decision
- Each view names its decision and its decision owner.
- Users from each role finish the view's decision tasks without help.
Principle 2, metrics
- The view shows 5–7 metrics, each tied to a decision.
- Every metric has a baseline, a unit and a time window in its label.
Principle 3, hierarchy
- Users name the primary metric and its status within five seconds.
- Every number has a drill-down path to its detail.
Principle 4, encoding
- Values use position or length; no gauge or pie carries a comparison.
- Status never relies on color alone, and chart marks meet 3:1 contrast.
Principle 5, states
- Alert, empty, loading and stale states exist for each card.
- A "last updated" time sits beside each data source.
Principle 6, consistency
- Filters, dates and status colors behave the same on every view.
- The same KPI card style means the same thing on every view.
Run the sheet on one view this week and log each fail with its principle number.
When does a product team need dashboard UX design help?
A product team needs dashboard UX design help when several roles share one dashboard, users export to spreadsheets or alerts get ignored, because each breaks structural dashboard principles.
A spreadsheet export means no view answers that user's decision. Several roles on one dashboard break principles 1 and 2, because an executive and an analyst need different metrics and levels of detail, and ignored alerts break principle 5.
Dashboard analytics was the main focus of the TradeZella dashboard revamp, part of a web and mobile product revamp; after the revamp and launch, the case study reports 40% more user interaction and a 25% boost in user retention, results of the whole revamp rather than any single principle. Our dashboard UX projects cost $25,000–$60,000 over 4–8 weeks, and what user roles and test rounds do to the price shows where yours lands.
An export spreadsheet is the cheapest evidence a team owns, because it lists the numbers the dashboard failed to show its user. Run the review sheet on the dashboard your team exports most; fails in principles 1, 2 or 5 call for structural work, because dashboard design best practices about styling leave those three untouched. Every project begins with a free consultation and a fixed-scope proposal, so send us a screenshot of the dashboard your team exports most, with the failed principle numbers marked on it.
FAQs
What makes a good dashboard design?
A good dashboard design lets each user role see, within seconds, whether to act and where to click next. The plainest test is the spreadsheet export: when users stop rebuilding its numbers by hand, the design is doing its job.
What is the best way to create an effective dashboard?
The best way to create an effective dashboard is to list the decisions each role makes before you open a BI tool. Effective dashboard design then picks the metrics for each decision, sketches the hierarchy, and tests a clickable prototype with users from every role before engineers build it.
What are the key principles for effective dashboard design?
The key dashboard design principles are decision-first scope, metric selection, information hierarchy, visual encoding, dashboard states and alerts, and dashboard consistency, applied in that order. Order matters because each principle depends on the one before it, and no chart choice fixes a view built for the wrong decision.
How many charts should a dashboard have?
A dashboard view should hold about as many charts as it has metrics, and our working range is 5–7 metrics per view. More detail belongs one drill-down level lower, where an analyst can open it without crowding the overview.
Are dashboard design principles different for mobile dashboards?
No, the principles stay the same on mobile, and only the layout changes. A phone layout stacks cards in priority order with the primary metric first and moves filters behind one control, and Power BI lets authors build a separate phone view of a dashboard.