Dashboard audit and stakeholder interviews
We review the dashboards you run today and ask each team which numbers it acts on.

Our dashboard consulting services put one team on the whole job: we advise on which dashboards and key performance indicators (KPIs) you need, design them and build them in Power BI, Tableau or Looker.





Get a free consultation
Free consultation · reply within one business day
In shortDashboard consulting services advise a company on which business intelligence (BI) dashboards, key performance indicators (KPIs) and BI tool it needs, then design and build them. Our advisory engagement takes 2–3 weeks and costs $5,000–$15,000; each of the two dashboard design engagements adds 4–8 weeks at $25,000–$60,000, and the build in the BI tool you choose is quoted in the fixed-scope proposal.
Dashboard consulting services are advisory, design and build work that decides which dashboards, key performance indicators (KPIs) and business intelligence (BI) tool a company needs, then delivers them. The work is a branch of business intelligence consulting and is also sold as dashboard advisory or dashboard reporting consulting.
The advice borrows its format from user experience (UX) advisory work, our UX consulting services: a senior dashboard consultant leads it and a written plan closes it. Two sibling services carry the design phase. Dashboard UX design sets what each user role sees, and dashboard design services set how the screens look. We then build the dashboards in the BI tool you choose.
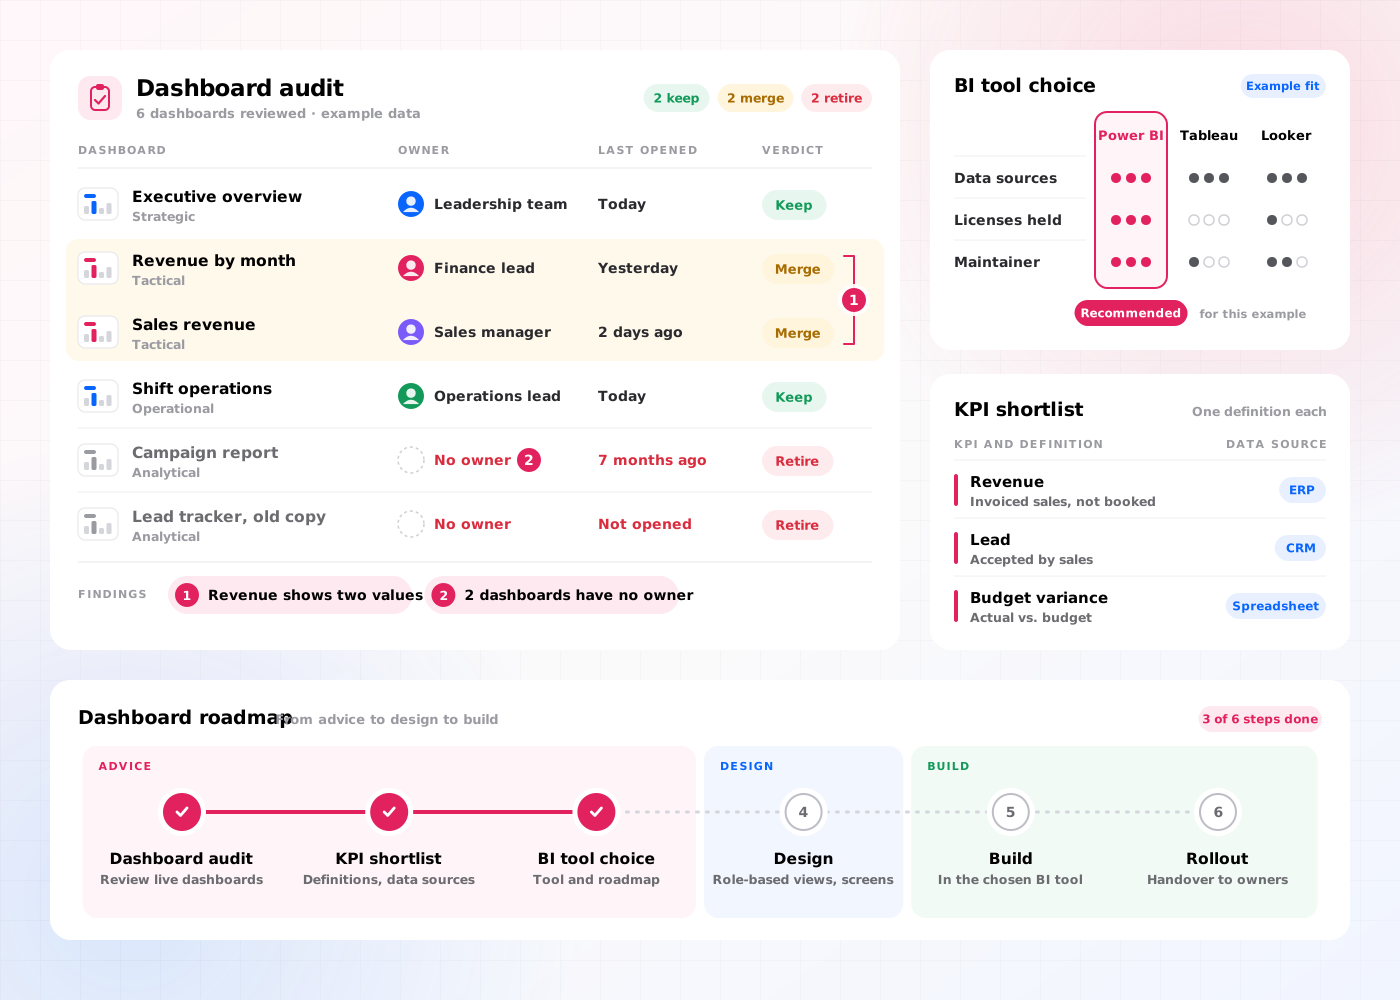
Our dashboard consulting services include 6 advisory deliverables: a dashboard audit, a KPI shortlist and definitions, a data source inventory, a BI tool recommendation, a dashboard roadmap and a rollout plan.
A review of every dashboard live today: which are opened, where two show different values for one KPI, and whether chart colors pass Web Content Accessibility Guidelines (WCAG) 2.2 contrast, for example 3:1 for chart lines against the background.
KPI selection cuts the list to the measures a decision depends on and gives each measure one written definition, for example whether revenue means booked or invoiced sales.
A list of the system behind each KPI, for example a customer relationship management (CRM) system, an enterprise resource planning (ERP) system or an Excel spreadsheet.
The BI tool choice among the three tools we build in, or a reasoned case for keeping your current tool, for example because its licenses are already paid for; a tool outside those three stays with your own developers.
The dashboard strategy on one page: which dashboards to design and build, in what order and for which user roles, for example an executive dashboard first.
Decided before the build: who receives each dashboard and who owns it after launch, for example the finance lead as owner of the revenue view.
Our dashboard consultants cover the four main dashboard types, each defined by the decision it supports, and the KPI dashboards each business function reads.
The type sets how fresh the data must be and how much detail a view carries, so the dashboard roadmap plans role-based dashboards, each with a named type and reader. The function headings below state the question each dashboard has to answer; the measures themselves come from your own KPI shortlist.
The four main types of dashboards are strategic, operational, analytical and tactical. A strategic dashboard shows senior management how the company performs against long-term goals. An operational dashboard gives the staff who run daily work current data. An analytical dashboard gives analysts drill-down and filters to find causes. A tactical dashboard lets department heads track departmental goals and projects.
An executive dashboard answers one question: is the company on target? It holds a few KPIs against their targets on a single screen, where they can be monitored at a glance, and is usually the strategic type.
A sales dashboard has to show where deals stall, and a marketing dashboard which channels bring the leads sales accepts. When both read CRM data, the two teams need one written definition of a lead.
A financial dashboard answers how actual figures compare with budget and forecast. Its numbers have to match the ledger, which is why our testing step compares each figure with the source system.
An operations dashboard tells a shift lead or planner what needs action now. It is the operational type in practice: current data, clear thresholds and few charts.
A clinical dashboard has to show a clinician what changed and what is still open. Our CalmChart project, a physician dashboard for the electronic health record (EHR), was a design project of this kind; the real-project section below describes it.
The advisory phase of dashboard consulting ends in a BI tool choice, and we build dashboards in three tools: Power BI, Tableau and Looker.
The tool is chosen in the advisory phase on three inputs: the data sources you hold, the licenses you already pay for and who maintains the dashboards after launch. We name no best tool in general. Custom dashboards coded outside a BI tool start from the developer handoff that closes the screen design phase; charts a BI tool does not offer are data visualization work.
No official top 5 ranking of dashboard tools exists. Five BI tools that teams build dashboards in are Microsoft Power BI, Tableau, Looker, Qlik Sense and Data Studio, which Google called Looker Studio until April 2026. Qlik Sense and Data Studio are named for completeness; we build in the first three.
Microsoft describes the product as its business analytics platform: reports are authored in a desktop app and shared through an online service. Power BI dashboard consulting follows the same six steps as our other dashboard consulting engagements, and our guide to Power BI dashboard design covers the design layer of its reports and dashboards for teams whose own developer does the build.
Tableau is the visual analytics platform from Salesforce, offered as a hosted cloud service or as server software a company hosts itself. That hosting choice is one input to the tool recommendation.
Looker is Google Cloud's platform for business intelligence. Its semantic data models are written in LookML, a modeling language that describes dimensions, aggregates, calculations and data relationships for the dashboards built on top.
The dashboard consulting process runs in 6 steps: the advisory phase takes 2–3 weeks, from the dashboard audit to the BI tool choice, then design and build follow. Each of the two dashboard design engagements takes 4–8 weeks, and the build timeline is set in the fixed-scope proposal.
We review the dashboards you run today and ask each team which numbers it acts on.
We agree on the KPI shortlist, write one definition per measure and trace each measure to its source system.
We recommend the BI tool, order the dashboards to build and present the plan, which closes the advisory phase.
Dashboard UX design sets role-based views and a tested Figma prototype, then dashboard design services set the final screens.
We build the dashboards in the chosen tool from the approved design and set up the data connections to your source systems.
We check each figure against its source system, share every dashboard with the user roles named in the plan and hand it to its owner.
Our dashboard development services cover 4 parts of the build: development in Power BI, Tableau or Looker, data connections, testing and rollout. This dashboard development process is the delivery half of dashboard consulting: we design and build dashboards as one team, and development is quoted in the fixed-scope proposal.
Each approved screen is built as a working dashboard in the tool chosen during the advisory phase, for example the executive view first.
This integration step connects each dashboard to the systems listed in the data source inventory, for example the CRM system and a finance spreadsheet.
Figures on the dashboard are compared with the same figures in the source system, for example month-end revenue against the ledger.
Each dashboard is shared with the user roles named in the advisory plan and handed to its owner, for example the sales views to the sales managers.
Dashboard consulting services have 4 benefits: one definition per KPI, fewer dashboards with named owners, a BI tool chosen on evidence and one team from advice to launch.
KPI selection writes each definition down before anything is built, so two teams stop reporting two values for one measure and data-driven decisions rest on one number.
The dashboard audit shows which dashboards nobody opens, so the roadmap keeps fewer of them and gives each an owner.
The BI tool is compared against your source systems and existing licenses before new licenses are bought.
One team carries the work from the tested prototype into the build, so the dashboards are built from the screens users tested.
Dashboard consulting decides which dashboards, KPIs and BI tool you need and carries them through to the build; the two design services shape the dashboards themselves. Requests for dashboard design consulting, the advice on layout and charts, run through our dashboard design services, so the table compares all three services on 7 criteria.
| Criterion | Dashboard consulting | Dashboard UX design | Dashboard design services |
|---|---|---|---|
| Question it answers | Which dashboards, KPIs and BI tool do we need? | Which decision does each view support? | Which chart shows each metric clearly? |
| Starts from | The dashboards and systems you have today | The decisions each user role makes | A validated dashboard structure |
| Main output | Dashboard audit, KPI definitions, BI tool recommendation and dashboard roadmap | Dashboard information architecture and tested prototype | High-fidelity screens and a component kit |
| Includes the build | Yes, in one of three BI tools | No | No, it ends in a developer handoff |
| Timeline | 2–3 weeks for the advice | 4–8 weeks | 4–8 weeks |
| Price on this site | $5,000–$15,000 for the advice; the build is quoted in the proposal | $25,000–$60,000 | $25,000–$60,000 |
| Choose it when | Nobody has agreed which dashboards, KPIs or tool the company needs | The dashboards to keep are decided and each role needs its own view | The structure is tested and the screens need their final look |
Related:dashboard UX designdashboard design servicesdata visualization agency
Dashboard consulting services cost $5,000–$15,000 for the 2–3 week advisory engagement. Each of the two dashboard design engagements adds $25,000–$60,000 over 4–8 weeks, and dashboard development in the BI tool is quoted in the fixed-scope proposal.
The advisory fee depends on 4 factors: the number of dashboards reviewed, the number of user roles, the number of data sources and the number of BI tools compared. The scope is fixed, not billed by the hour. Every project begins with a free consultation and a fixed-scope proposal, which is where the build is quoted. For the design phase, see the four factors behind a dashboard UX design price.
A team should hire dashboard consultants in 5 situations, each one a KPI, BI tool or build decision that nobody owns yet:
Our CalmChart project was a dashboard UX and design engagement, not a dashboard consulting or build project, but it shows the decisions KPI selection settles first.
CalmChart is a physician dashboard, a calmer front end for the EHR. The CalmChart case study shows 5 core screens that each answer one question, 3 alert levels of which only the highest interrupts, and 4 inbox actions in place of one undifferentiated list. KPI selection asks the same question of every dashboard: what must this screen answer? A second design project, the TradeZella case study, reports 40% more user interaction after a dashboard revamp and a 25% boost in user retention. Read both before scoping your own dashboards.
Tell us which dashboards you run today and which BI tool you use. Every project begins with a free consultation and a fixed-scope proposal.
Book a free consultationWe design UI and UX for Healthcare, Finance, Supply chain and SaaS products.
Send us your project. A design lead reviews it and schedules a call within one business day. We sign an NDA before the first technical discussion if you prefer.
These 11 answers about dashboard consulting cover the consultant's role, the build in a BI tool, rates, existing systems and dashboards, timing, handover and the first step.
Still have a question?
A design lead answers every message within one business day.
Talk to a design leadA dashboard consultant audits the dashboards a company runs, selects and defines its KPIs, recommends the BI tool and plans which dashboards to build first. With us, a senior consultant leads that advisory engagement, and the same team then designs and builds the dashboards.
Yes, we do both. Our dashboard development services cover the build in Power BI, Tableau or Looker, the data connections, testing and rollout, after the same team has advised on and designed the dashboards. Development is quoted in the fixed-scope proposal.
An in-house analyst, a freelance BI developer or an agency can build a dashboard for your company; the harder question is who decides which KPIs go on it. We do both jobs as one team: we advise on the KPIs and the tool, design the dashboards and build them.
Yes, if the scope is fixed too. An hourly rate says nothing about the hours behind it, so two consultants at $100 an hour can send very different invoices. We quote a fixed scope instead: $5,000–$15,000 for the 2–3 week advisory engagement.
No fixed Big 5 exists today. The label usually points to the largest accounting and advisory firms, now called the Big Four (Deloitte, PwC, EY and KPMG); they were the Big Five until Arthur Andersen broke up in 2002. Dashboard consulting is specialist work, and a firm's size does not decide who selects your KPIs; we are a specialist design agency in Reston, Virginia.
An effective dashboard supports one decision per view for one user role, shows a few KPIs with one definition each and uses chart colors that pass WCAG 2.2 contrast. It also passes the 5-second rule: a reader names the page's subject and spots anything that needs action within about five seconds, a heuristic to test with users.
Yes. Data connections are part of the build, and the data source inventory lists each system first, for example a CRM system, an ERP system or spreadsheets. Listing the systems first shows, before the build is quoted, how many connections each dashboard needs.
Yes. The dashboard audit starts from the dashboards you already have and marks each one to keep, merge or retire. The ones you keep go into the dashboard roadmap for a redesign and, where needed, a rebuild in one of the three BI tools we build in.
Dashboard consulting takes 2–3 weeks for the advisory engagement, which equals 10–15 working days. Each of the two dashboard design engagements adds 4–8 weeks, and the build timeline is set in the proposal.
After go-live, the work ends with a handover: the dashboards pass to the owners named in the rollout plan, together with the written KPI definitions. Work after the handover is outside the scope unless the proposal names it.
Start with a free consultation: send us the list of dashboards in use today and the name of your BI tool, if one is chosen. A fixed-scope proposal follows, and it is where the advisory engagement is priced and the build is quoted.