

Key takeaways
- Decide the audience, the decision each page supports and its key metrics before anyone opens Power BI Desktop.
- Set the 16:9 report canvas first, 1280 x 720 or 1920 x 1080, so a Figma frame at that size carries spacing straight into the build.
- A report theme file sets data colors, status colors and text classes once, for every visual on every page.
- Tiles pinned to a Power BI service dashboard drop border, shadow, background and title formatting, so plan them separately.
- A designer owns the canvas, grid, theme values and visual rules; the Power BI developer owns the semantic model, measures and the build.
Power BI dashboard design sets the report canvas, layout grid, report theme and visual rules that every report page reuses. Its color and text rules fit in six lines of a JavaScript Object Notation (JSON) theme file: an illustrative one names the brand, lists three data colors (blue #1F4E79, teal #2E86AB, orange #F18F01), sets "good" to green #2E7D32 and "bad" to red #C62828, makes the background white and sizes every title at 14 points. Change one value, and every visual that uses the theme palette follows on every page.
To design a Power BI dashboard, decide the audience and key metrics first, then set the canvas and grid, write the report theme, choose visuals, plan navigation, design the mobile layout and pinned tiles, and check accessibility last. Each layer constrains the next, so a theme written before the canvas is settled gets rewritten. Our dashboard design services cover Power BI alongside Tableau and Looker, three business intelligence (BI) tools, with layout and color rules for each.
What is Power BI dashboard design, a dashboard or a report?
Power BI dashboard design is the visual layer of Power BI report pages and service dashboards, from the report canvas and report theme to visual choice and navigation.
Most of the work happens on report pages in Power BI Desktop, so teams whose Power BI reports run to many pages call it Power BI report design. Power BI UI design, after the user interface (UI), and plain Power BI design name the same job: the interface, not the semantic model, which is the Power BI data model behind it.
The overview shows the seven layers in build order, each resting on the one above.
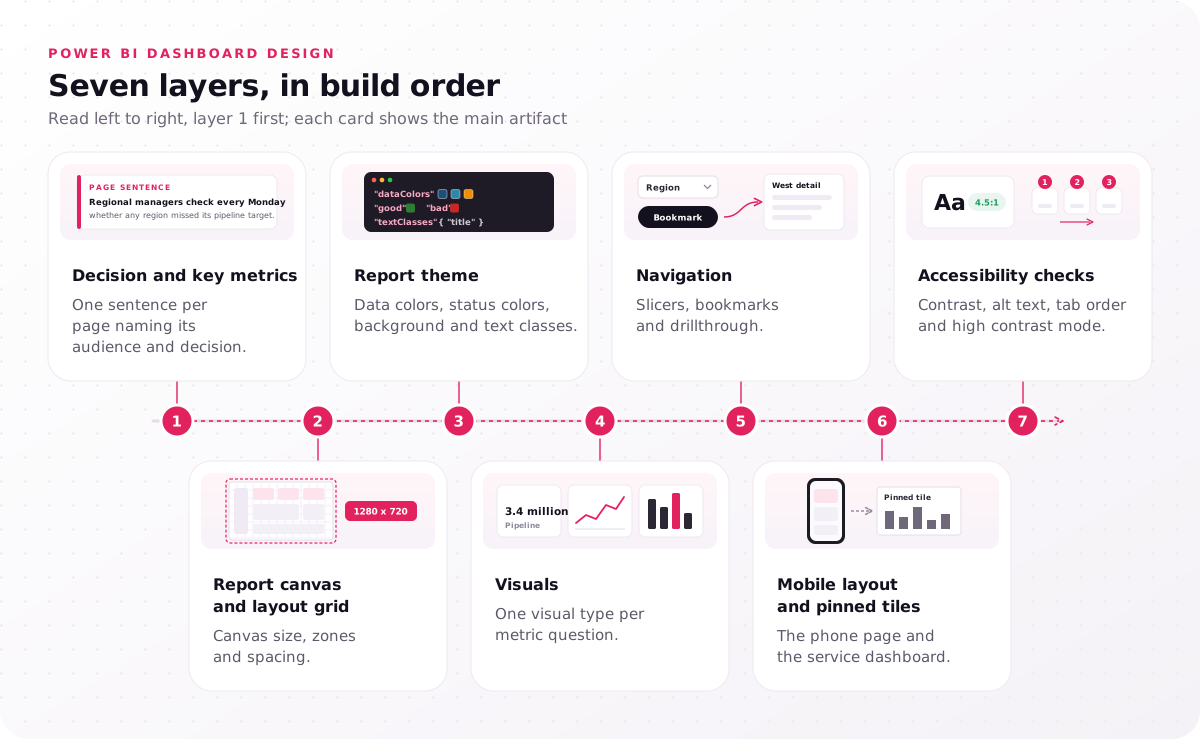
- Decision and key metrics: one sentence per page naming its audience and decision.
- Report canvas and layout grid: canvas size, zones and spacing.
- Report theme: data colors, status colors, background and text classes.
- Visuals: one visual type per metric question.
- Navigation: slicers, bookmarks and drillthrough.
- Mobile layout and pinned tiles: the phone page and the service dashboard.
- Accessibility checks: contrast, alt text, tab order and high contrast mode.
Does Power BI make dashboards?
Yes. In the Power BI service, a dashboard is one canvas of pinned tiles taken from one or more reports, while a report built in Power BI Desktop can hold many pages.
This guide calls the Microsoft object a Power BI service dashboard and one screen of a report a report page. An illustrative example: a sales operations team keeps a service dashboard of six pinned tiles for its weekly meeting, with three report pages behind it for pipeline, win rate and regional detail.
What are the four types of dashboards?
The four types of dashboards are operational, strategic, analytical and tactical, each named for the kind of decision it supports.
Operational and strategic views that people check at a glance suit a Power BI service dashboard, while analytical and tactical work needs slicers and drillthrough on report pages. Name each page's type before you draw it, because the type sets how dense its canvas can get.
Which decisions come before you open Power BI Desktop?
Good Power BI dashboard design starts before Power BI Desktop opens, with the audience, the decision each report page supports and its key metrics, then a wireframe at report canvas size.
Microsoft's design tips open with user experience (UX) questions, the Power BI UX side of the job: who the audience is, which key metrics drive their decisions, and where the page is displayed, since a large monitor holds more than a phone. Write the answers as one line per page, for example "Regional managers check every Monday whether any region missed its pipeline target." The page's key performance indicators (KPIs) are the numbers that sentence needs, and nothing else.
Choosing which metrics each role sees, and in what order, is dashboard UX design work. When that structure is unsettled, styling it only makes the confusion look finished.
Then wireframe each page in Figma at the canvas size the report will use, 1920 x 1080 for new pages under the Fluent 2 base theme or 1280 x 720 for older ones, so every gap measured in the wireframe means the same pixels in Power BI Desktop. Write the decision sentence for your busiest page before anyone opens a blank report.
How do you set the report canvas and layout grid?
In Power BI report design, set the 16:9 report canvas first, 1280 x 720 or 1920 x 1080, then a layout grid that places the highest-level number top-left.
Power BI Desktop offers 16:9, 4:3, Letter, Tooltip and Custom canvas types; under 16:9, the canvas size options are 1280 x 720 (high definition, HD), 1920 x 1080, 2560 x 1440 and 3840 x 2160. The theme file can set a default page size for new pages, so every author starts from one frame. Turn on Show gridlines and Snap objects to grid in the View menu while placing visuals.
Divide the canvas into the three zones the mockup marks. Microsoft's tips put the highest-level data top-left, where a reader of a left-to-right language looks first, and that visual hierarchy fits most report pages.
Spacing and alignment do the rest. Gestalt principles explain why: items that share spacing and edges read as one group, so one uneven gap splits a row of KPI cards into two clusters. Fit each page on one screen with no scroll bars ("tell a story on one screen," in Microsoft's words), and check it in full-screen mode if it will run on a wall display. Warehouse supervisors are one such audience: in the supply chain products we design, supervisor tools pair a tablet view with a wall-display dashboard for throughput and backlog.
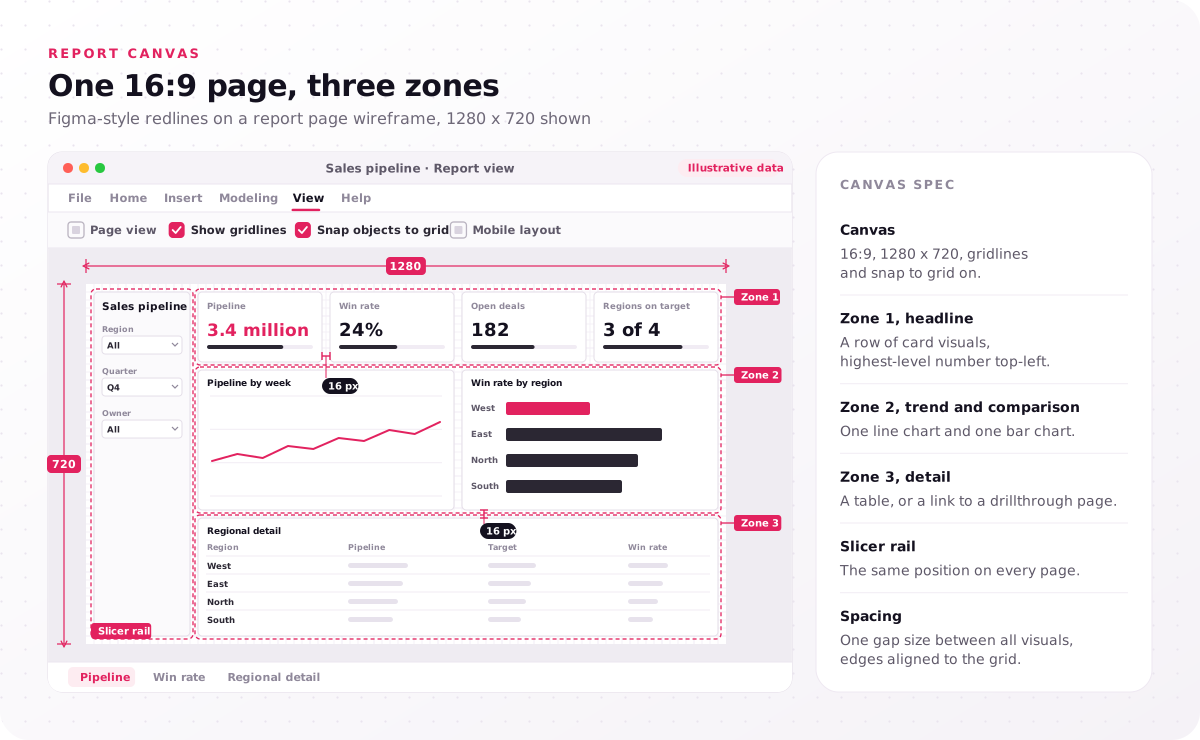
- Canvas: 16:9, 1280 x 720, gridlines and snap to grid on.
- Zone 1, headline: a row of card visuals, highest-level number top-left.
- Zone 2, trend and comparison: one line chart and one bar chart.
- Zone 3, detail: a table, or a link to a drillthrough page.
- Slicer rail: the same position on every page.
- Spacing: one gap size between all visuals, edges aligned to the grid.
What is the best dashboard design for Power BI?
The best dashboard design for Power BI is a one-screen page with the key number top-left, every visual on one grid, and the same spacing, fonts and colors throughout.
That consistency is also what makes a page look pretty: readers rarely notice a clever chart, but they notice a misaligned one. The best layout for a Power BI dashboard repeats the same three zones on every page, so users learn where to look once. Draw the zones on a printout of your busiest page; a visual that fits none of them belongs on a drillthrough page.
How does a report theme carry your brand into every visual?
A report theme is the JSON file behind Power BI dashboard design that sets data colors, status colors, background and text classes for every visual on every page at once.
Microsoft documents each key of a custom theme and publishes a JSON schema, so your developer can validate the file before import; the token map shows the main keys.
In Power BI Desktop, the Design ribbon holds the built-in themes plus Customize, Import and Download theme. Two habits keep a custom theme working: authors pick colors from the theme palette rather than "More colors", so visuals update when the theme file changes, and they avoid format-pane overrides, which stay on a visual until someone resets it to default. Your Power BI developer can reference the status colors by name in conditional formatting rules.
For companies with many report authors, organizational themes, in preview as of November 2026, let tenant admins upload and enable a theme file in the Microsoft Fabric admin portal; authors then pick it from the Organizational themes section of the theme gallery.
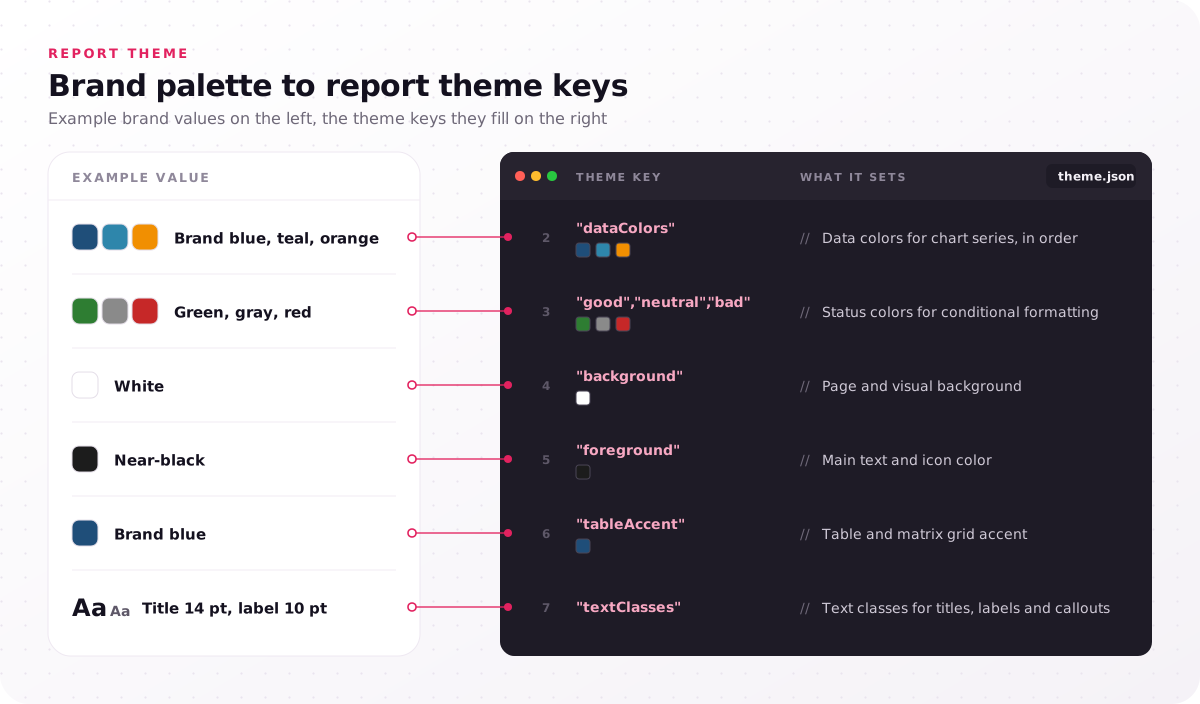
| Theme key | What it sets | Example value |
|---|---|---|
| dataColors | Data colors for chart series, in order | Brand blue, teal, orange |
| good, neutral, bad | Status colors for conditional formatting | Green, gray, red |
| background | Page and visual background | White |
| foreground | Main text and icon color | Near-black |
| tableAccent | Table and matrix grid accent | Brand blue |
| textClasses | Text classes for titles, labels and callouts | Title 14 pt, label 10 pt |
What is the best theme for Power BI?
No single theme is best for Power BI; the best report theme is a custom one built from your brand palette, with text contrast of at least 4.5:1 against its background.
Built-in themes such as Bloom, Divergent and Frontier suit drafts, but they carry Microsoft's palette, not yours. When a brand color fails contrast, keep its hue for chart fills and darken it for text, then test every text color in a contrast checker before the values go to your developer.
Which Power BI visuals fit each metric on the page?
Power BI design gives each metric on the report canvas its simplest visual: a card visual for the headline number, bar and column charts for comparisons, line charts for trends.
Microsoft's tips ask you to use the right visualization for the data and accent the most important information, which is the card visual's job. Give its number context, such as the target beside it. The other Power BI dashboard design best practices fit in a short rule list:
- Pie chart limit: fewer than eight categories, and a bar or column chart when values need comparing, because pie charts do not place values side by side.
- Gauge charts: only for status against a goal, the one question they answer.
- 3D charts: avoid them, because depth distorts the values.
- Number formatting: 3–4 numerals, scaled ("3.4 million"), so numbers read at a glance.
- Tables of figures: tabular numerals, right-aligned decimals and a fixed column order, rules our financial dashboard design uses because traders and analysts compare many figures at once.
- Scales and colors: the same axis scale and dimension color across visuals, so "West" is one color everywhere.
- Time frames: never mix weekly and yearly figures unlabeled, because readers compare them as equals.
- Mixed measures: separate axes for large and small measures, so the small one is not flattened.
- Data labels and sort order: drop labels the axis already gives, and sort on purpose, so rank means something.
Titles, labels and annotations finish the job: "West missed target three weeks running" tells readers what to see, where "Sales by region" leaves them to hunt. The theme's text classes keep that typography hierarchy the same on every page. For depth, Microsoft's tips list Stephen Few's Information Dashboard Design and Edward Tufte's Envisioning Information. Copy the rules into your style guide so every author applies one list.
How do slicers, bookmarks and drillthrough stay usable?
Usable Power BI report design keeps every slicer in one position, font and color on every page, and bookmarks and drillthrough keep detail one click off the report canvas.
Microsoft's accessibility checklist asks for consistent slicers, so slicer position is a style-guide rule, not an author's choice. Decide once where filters live: on-canvas slicers suit the few filters every reader uses, and the filter pane suits long lists only analysts open.
Bookmarks save a page state, such as a filter selection or hidden panel, and turn buttons into navigation; drillthrough sends a user from a summary visual to a detail page filtered to their pick. Tooltips carry supporting detail only, never key information, because users who do not use a mouse struggle to reach them. Before sign-off, walk every bookmark button and drillthrough path with the keyboard alone.
How do you design the mobile layout and pinned tiles?
Power BI UI design for phones needs a mobile layout separate from the report canvas, and pinned tiles need their own plan, because they drop border, shadow, background and title formatting.
In the mobile layout view of Power BI Desktop, authors place visuals on a phone emulator canvas or let auto-create draft one from the desktop page, and phones held in portrait show that layout automatically. Design a reordered page, not a shrunken one: headline card visual first, one chart per screen height, and fewer tiles, as Microsoft advises for phones and tablets. A mobile page indicator, still in preview in the October 2026 update, shows an icon on the tab of each page that has a mobile layout, so gaps are easy to spot.
Pinning drops styling that the report page keeps: a pinned tile ignores several visual settings, and if you choose Use dashboard theme when pinning, it takes the dashboard theme instead of the report theme. The diff lists each item Microsoft documents.
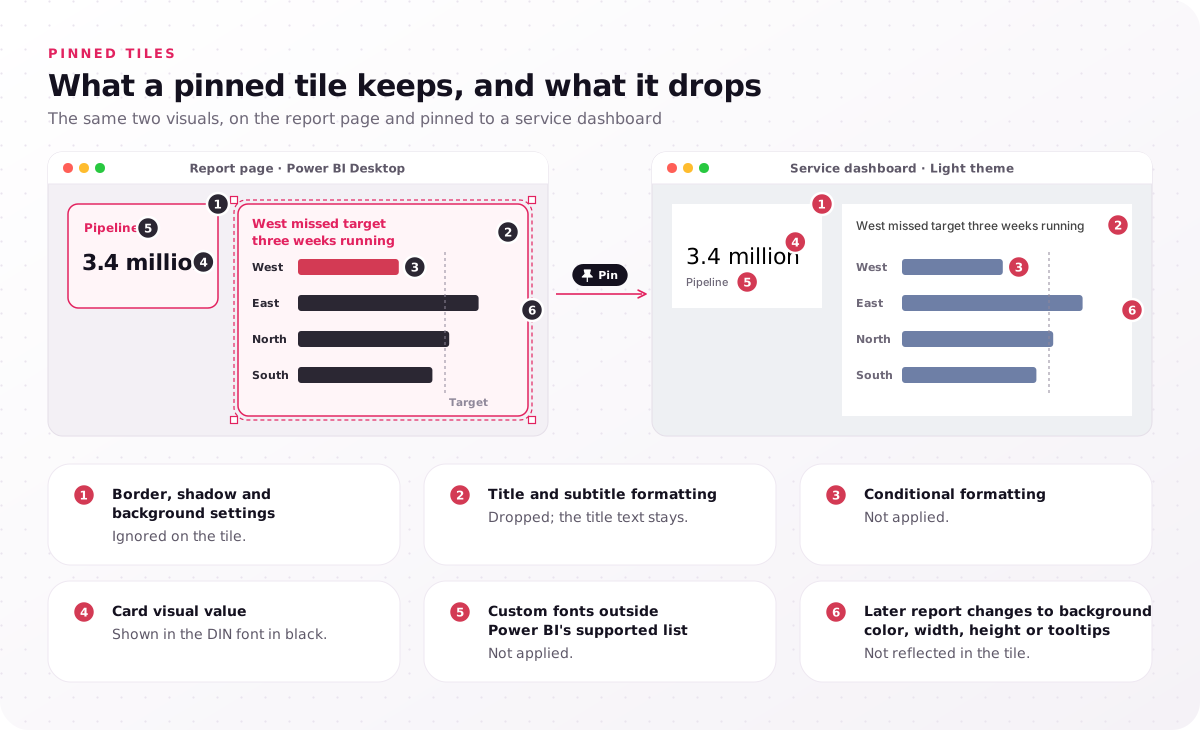
- Border, shadow and background settings: ignored on the tile.
- Title and subtitle formatting: dropped; the title text stays.
- Conditional formatting: not applied.
- Card visual value: shown in the DIN font in black.
- Custom fonts outside Power BI's supported list: not applied.
- Later report changes to background color, width, height or tooltips: not reflected in the tile.
So carry the meaning in the visual itself, with a title that states the finding, or pin a whole live report page and check it in the service, since dashboard themes do not apply to pinned live report pages. A dashboard theme is Light by default, with Dark and Custom options; a custom one accepts a JSON upload, and Microsoft recommends a background image size of at least 1920 x 1080, added by public image URL. Pin one test tile to a scratch dashboard before the report theme is signed off.
How do you make Power BI dashboard design accessible?
Accessible Power BI design keeps text contrast at 4.5:1 or more on the report canvas, never uses color alone, gives every non-decorative visual alt text and sets the tab order.
Microsoft's report accessibility checklist applies that ratio to titles, axis labels, data labels and text boxes, and asks authors to check palettes for color vision deficiency. Alt text holds up to 250 characters, and since screen readers already announce a visual's title and type, it should state the insight; conditional formatting can make it change with the filtered data. Tab order is set in the Selection pane, with decorative shapes removed.
Power BI Desktop detects Windows high contrast mode, while in the Power BI service the result depends on the browser. Line markers with a different shape per series help readers who cannot tell lines apart by color, and the "Show data" table and a deliberate sort order help screen reader users follow the numbers.
Microsoft documents Power BI against the Web Content Accessibility Guidelines (WCAG), committing to WCAG 2.1, US accessibility conformance and EN 301 549. Our dashboard color palettes are checked against WCAG 2.2; that is our own check, not a claim that Power BI conforms to WCAG 2.2.
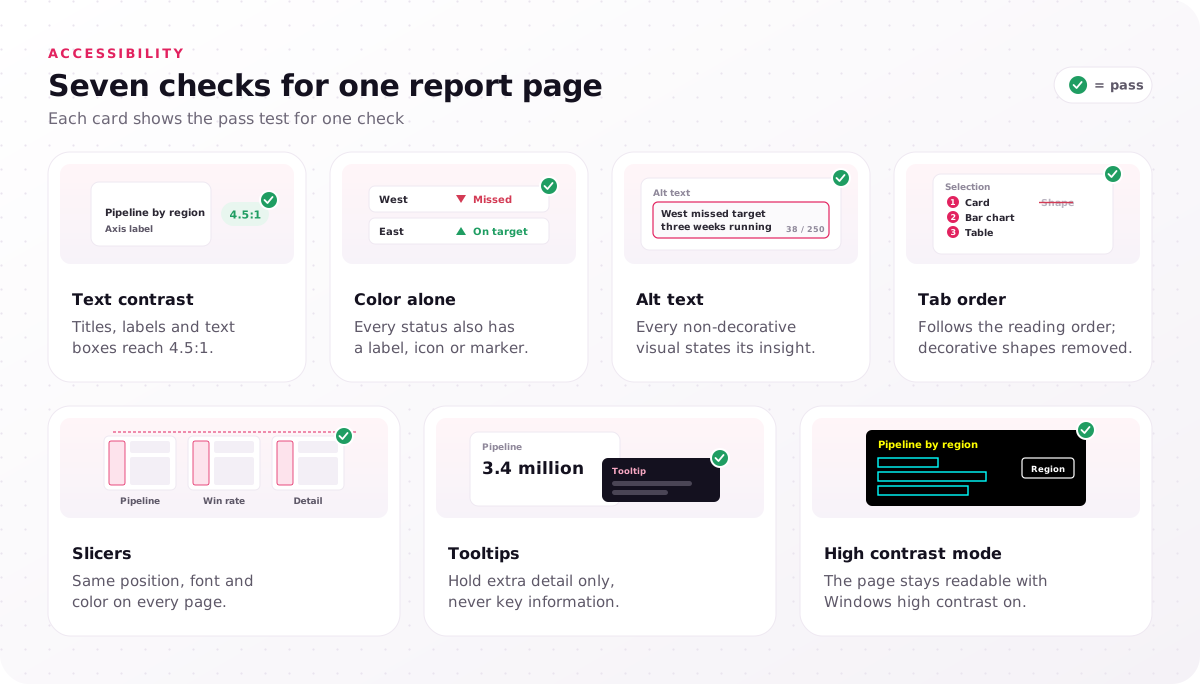
- Text contrast: titles, labels and text boxes reach 4.5:1.
- Color alone: every status also has a label, icon or marker.
- Alt text: every non-decorative visual states its insight.
- Tab order: follows the reading order; decorative shapes removed.
- Slicers: same position, font and color on every page.
- Tooltips: hold extra detail only, never key information.
- High contrast mode: the page stays readable with Windows high contrast on.
Run these checks on one finished page before its styling is copied to the rest of the report.
Who designs a Power BI dashboard, designer or developer?
Power BI dashboard designs need both roles: a designer owns the report canvas, grid, theme values and visual rules, and a Power BI developer owns the semantic model and build.
The matrix splits Power BI dashboard design work row by row. The developer's side includes Data Analysis Expressions (DAX) measures, row-level security, refresh and publishing. We design and specify the visual layer and review the built pages; we do not write DAX, model data or publish reports.
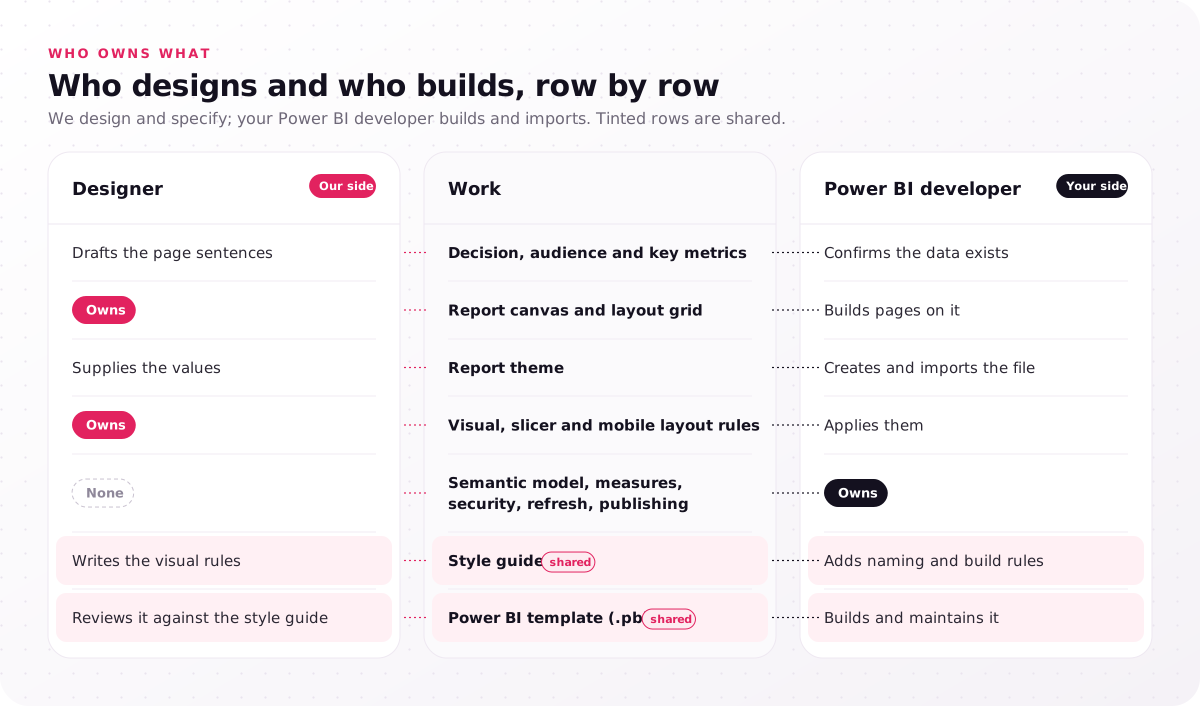
| Work | Designer | Power BI developer |
|---|---|---|
| Decision, audience and key metrics | Drafts the page sentences | Confirms the data exists |
| Report canvas and layout grid | Owns | Builds pages on it |
| Report theme | Supplies the values | Creates and imports the file |
| Visual, slicer and mobile layout rules | Owns | Applies them |
| Semantic model, measures, security, refresh, publishing | None | Owns |
| Style guide (shared) | Writes the visual rules | Adds naming and build rules |
| Power BI template (.pbit) (shared) | Reviews it against the style guide | Builds and maintains it |
The style guide is the shared artifact: fonts (analytics8's Power BI style guide post suggests Arial or Calibri when there is no brand font), logo placement, colors, one KPI format and order, the maximum visuals per page, filter location and naming. A uniform style promotes adoption, because users stop relearning each report. Many teams pair it with a Power BI template (.pbit) holding the theme file and starter pages, a theme and template pair your developer builds from the style guide.
A Figma kit whose KPI card component matches the card visual keeps designs buildable, and the last step of our 5-step dashboard design process reviews the first built pages against the Figma files. Name an owner for every matrix row before the first page is built.
When is Power BI dashboard design worth a design team?
A design team pays off in Power BI UI design when authors' pages differ, users misread charts, a brand or dark report theme is due, or a rollout needs one style.
Each signal points to a missing shared layer, not a missing developer skill:
- Pages differ by author, because no shared theme file or style guide exists.
- Users misread charts or export to Excel, because the visual choice hides the number they came for.
- A brand refresh or dark mode is due, because every data and status color must pass contrast again.
- A rollout will add many reports, because one style set now saves rework on each one.
- Power BI dashboards are moving to a custom front end, because that build needs a branded interface, which the same service covers.
That is the Power BI side of our dashboard design services: 4–8 weeks ending in the six dashboard design deliverables, which for Power BI become the grid, visual rules, report theme values, Figma pages at canvas size, a component kit and a developer handoff package, followed by a review of the first built pages. The service page sets out what a dashboard design engagement costs, $25,000–$60,000.
Which of your report pages would change color if you swapped the theme file today? Any visual that kept its old colors was styled through "More colors" or a format-pane override, and that is where Power BI dashboard design stops being shared. In a free consultation, the step every project starts with before a fixed-scope proposal, we go through one exported report page against your brand colors and mark the canvas, theme and accessibility fixes.
FAQs
Is Power BI still relevant in 2026?
Yes. Microsoft shipped its October 2026 Power BI update with a Gantt chart and a dropdown mode for list slicers, both in preview, and Power BI is part of Microsoft Fabric, whose admin portal manages organizational themes. Power BI is not outdated; its interface changes month to month, one more reason to keep styling in one theme file.
Can you learn Power BI in 7 days?
Yes, the basics: Microsoft's "Get started with Microsoft data analytics" learning path covers the analytics process, Power BI building blocks, Microsoft Fabric and Copilot in four modules. Power BI is not very difficult to start, but report pages people trust take longer, because canvas, theme and accessibility choices come from practice.
What is the 5-second rule for dashboards?
The 5-second rule says a reader should be able to name a page's subject and spot anything that needs action within about five seconds of looking. Treat it as a heuristic to test with users, not a measured law; on a Power BI report page, it mostly rests on the headline card visual top-left.
How do you make a Power BI dashboard look professional?
Make a Power BI dashboard look professional, or simply pretty, through consistency: one theme file, one grid, one gap size and the same slicer position on every page. Remove 3D effects, extra borders and repeated data labels before adding anything new.
Can you design a Power BI dashboard in Figma first?
Yes. Set the Figma frame to the report canvas size, 1920 x 1080 for new pages or 1280 x 720 for older ones, so grid and spacing transfer; your developer then builds the page and imports the theme file. Keep any background image from Figma small, because Microsoft notes large images can fail when a visual is pinned to a dashboard.
How many visuals should a Power BI report page have?
There is no official number of visuals per page. Microsoft's guidance is one screen without scroll bars and fewer tiles for phones and tablets, so size each page from the decision it supports and set your own maximum in the style guide.