
Key takeaways
- The types of charts are easiest to choose by the data question they answer, from comparison and change over time to part-to-whole, distribution, relationship, flow, hierarchy and geography.
- No official count exists; a commonly listed basic five is the bar chart, line chart, pie chart, scatter plot and histogram.
- Bars start at a zero baseline, and a pie works only for a few parts of one whole.
- Accessible charts need 3:1 contrast for chart marks under the Web Content Accessibility Guidelines (WCAG) 2.2, plus a text summary and a data table.
- Before a chart ships, have users answer 5 questions with it; one wrong answer shows what to change.
Most lists of the types of charts are sorted by shape, yet you choose a chart by the data question it has to answer. Take one made-up dataset for a software-as-a-service (SaaS) app: weekly active users on its Free, Team and Business plans. "Is usage growing?" needs a line chart, "which plan is largest?" needs a sorted bar chart, and "what share does each plan hold?" needs a stacked bar, so one table produces three charts.
Question first, chart second: that rule runs through all data visualization work, including ours as a data visualization agency, and it files every chart in this guide under the question it answers.
What are the types of charts, and how do you pick one?
The types of charts are families of data charts, such as bar, line, pie, scatter and heat map charts, and you pick one by the data question it must answer.
A chart type is the visual form a data chart uses: its marks (bars, lines, dots, slices) and its axes. Mapping numbers to position, length, angle, area or color is called visual encoding, and choosing it per question is the first step of data visualization design. The different types of charts fall into comparison charts, time series charts, part-to-whole charts, distribution charts, relationship charts, and flow and hierarchy charts, plus maps; some kinds of charts fit two families.
- Write the data question in one sentence, such as "Which plan has the most weekly users?"
- Name the data type and the category count. Categorical data (plans), ordinal data (rating levels) and continuous data (dates, revenue) need different axes, and 4 categories fit where 40 do not.
- Pick the family, then the best chart, from the chooser matrix that follows.
- Sketch one alternative and test both. In our chart selection step, designers sketch 2–3 visual encodings per question.
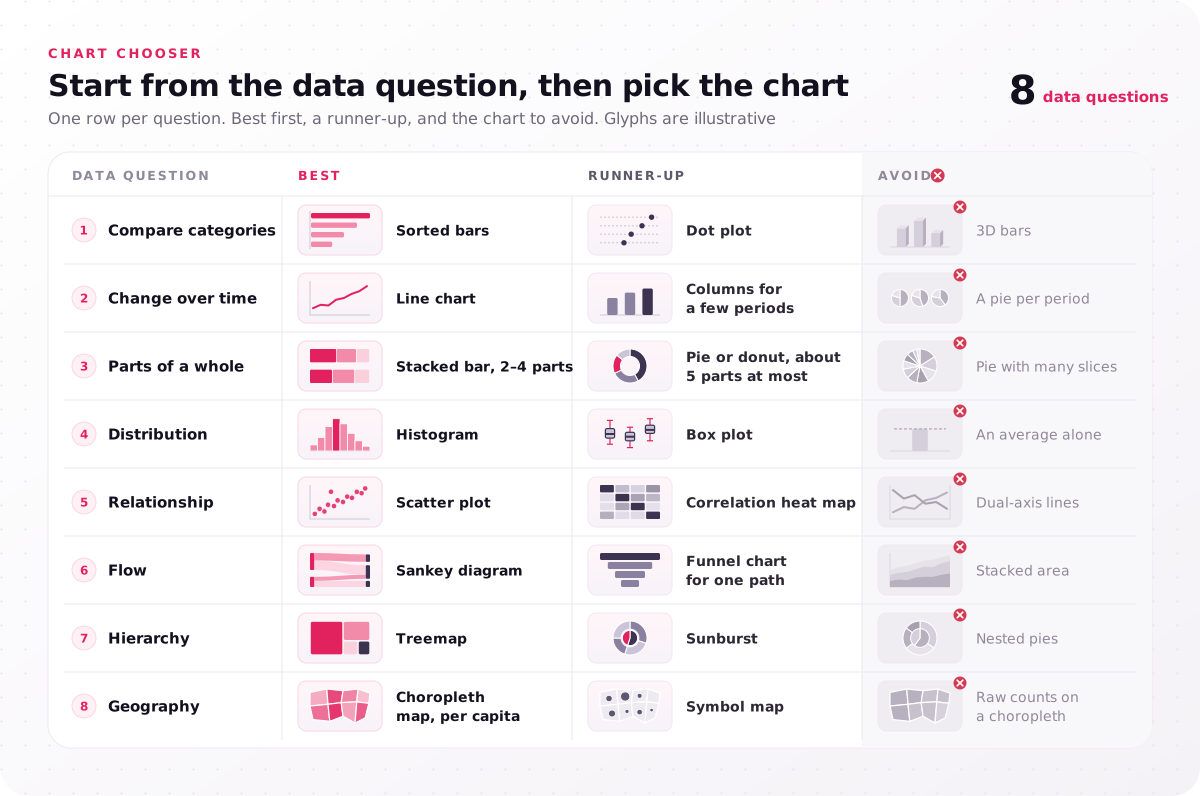
| Data question | Best | Runner-up | Avoid |
|---|---|---|---|
| Compare categories | Sorted bars | Dot plot | 3D bars |
| Change over time | Line chart | Columns for a few periods | A pie per period |
| Parts of a whole | Stacked bar, 2–4 parts | Pie or donut, about 5 parts at most | Pie with many slices |
| Distribution | Histogram | Box plot | An average alone |
| Relationship | Scatter plot | Correlation heat map | Dual-axis lines |
| Flow | Sankey diagram | Funnel chart for one path | Stacked area |
| Hierarchy | Treemap | Sunburst | Nested pies |
| Geography | Choropleth map, per capita | Symbol map | Raw counts on a choropleth |
Write down the one question your next chart must answer before you open a chart menu.
Is it a chart or a graph?
A graph is a chart that plots values on axes, so every graph is a chart, while a pie chart, which has no axes, is a chart but not a graph.
Most people searching types of graphs want the same list, because everyday data work swaps the two words freely. A diagram shows structure or process, such as a flowchart, and graph theory in mathematics uses "graph" for a network of nodes and edges. A table is not a chart, yet every chart needs one as the text alternative a screen reader user relies on.
How many types of charts are there?
No official count of the types of charts exists: catalogs list from about 20 to about 80, and the Financial Times Visual Vocabulary groups them by data question into 9 categories.
Nielsen Norman Group (NN/g) advises bar charts, line charts or scatter plots in the vast majority of cases, because other forms make readers judge angle, area or volume. So a catalog of 80 types of charts and graphs shows what exists, not which one to use. Each common count maps to a set:
- Five basic types, a set many guides list: bar chart, line chart, pie chart, scatter plot and histogram.
- Four types: comparison, distribution, composition and relationship, the four branches of Andrew Abela's 2006 chart chooser.
- Six types: the six chart families in this guide, from comparison and time series charts to flow and hierarchy charts.
- Eight types: the eight data questions in the chooser matrix, which add geography and split flow from hierarchy.
- The 10 or 12 most common: the five basics plus column, area, donut, stacked bar, box plot, heat map and treemap.
- Sixteen with examples: those 12 plus the bubble chart, waterfall chart, Sankey diagram and choropleth map.
- All types: the Financial Times groups them into deviation, correlation, ranking, distribution, change over time, magnitude, part-to-whole, spatial and flow.
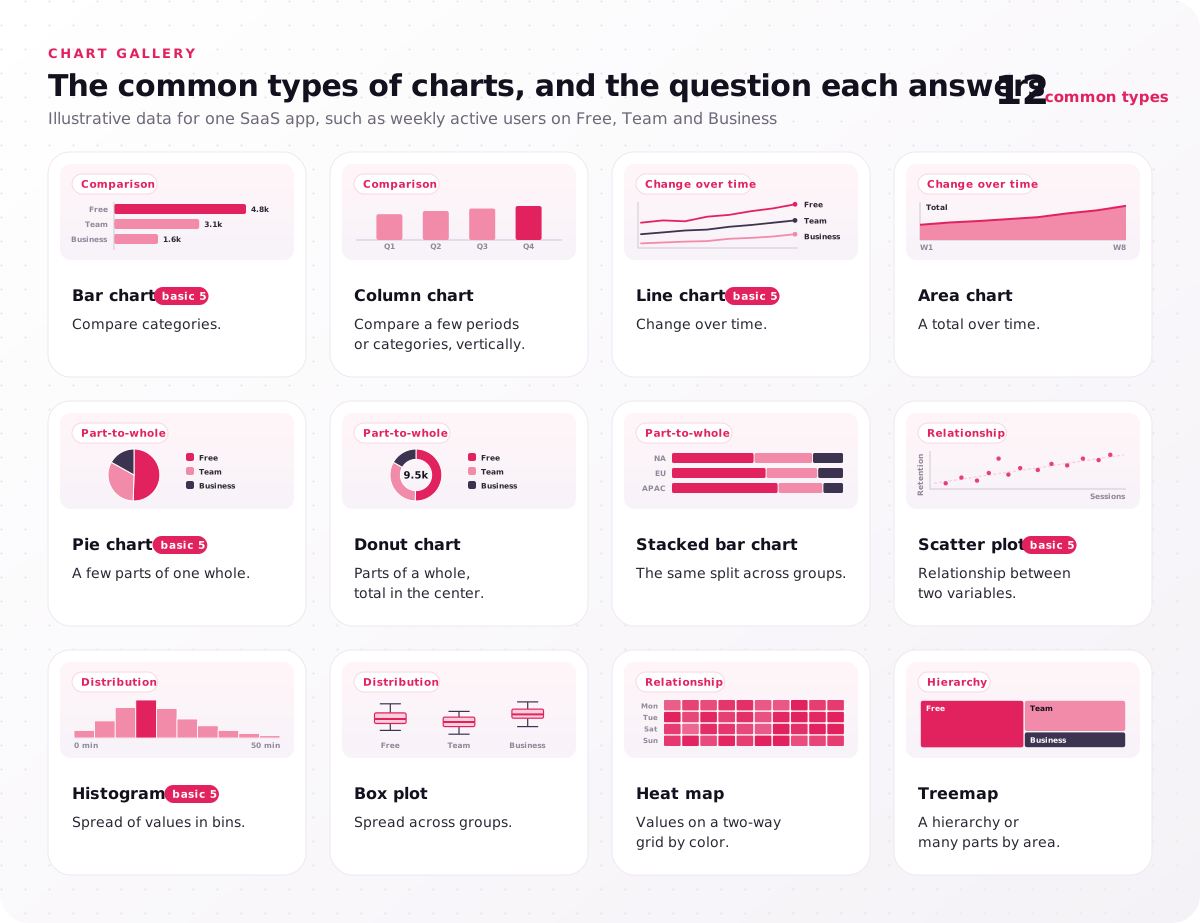
- Bar chart (basic 5): compare categories.
- Column chart: compare a few periods or categories, vertically.
- Line chart (basic 5): change over time.
- Area chart: a total over time.
- Pie chart (basic 5): a few parts of one whole.
- Donut chart: parts of a whole, total in the center.
- Stacked bar chart: the same split across groups.
- Scatter plot (basic 5): relationship between two variables.
- Histogram (basic 5): spread of values in bins.
- Box plot: spread across groups.
- Heat map: values on a two-way grid by color.
- Treemap: a hierarchy or many parts by area.
Microsoft Excel groups its chart types into more than a dozen families on its Office chart page, and the FAQs list them. Learn the five basic charts first, and reach for the rest only when a question needs them.
Which types of charts compare values across categories?
Bar charts are the types of charts that answer a comparison data question best, because readers judge bar length against a shared zero baseline.
A column chart is the same comparison with vertical bars; turn bars horizontal when labels are long. The zero baseline is not optional: a value axis that starts at 40 makes a 45 look more than twice the size of a 42. Comparison charts have four close relatives:
- Grouped bars for 2–3 series per category, such as this year against last year.
- Dot plot when values sit far from zero, because dots need no baseline.
- Bullet chart for one value against a target, the key performance indicator (KPI) case.
- Radar chart for one profile across 5–8 measures, because overlapping shapes turn hard to read.
As a rule of thumb for category count, past 10–12 bars, show the top 10 plus "Other", or use a table; for planners facing thousands of stock keeping units (SKUs), the planning tools we design for supply chain products can show, for example, an exception list ranking SKUs by forecast error and stockout risk. In the TradeZella journal screens we designed, an example of our financial dashboard design work, a Net Daily P&L (profit and loss) bar chart shows green profit and red loss days, so traders see at a glance whether each day was a winner or a loser. Digno, a performance evaluation SaaS we designed, uses an employees bar chart that compares four employees' scores, with the top performer highlighted at 88%. Sort your bars by value unless the categories carry their own order, such as months.
Which charts show change over time?
For a change-over-time data question, the best chart types are a line chart for a continuous time interval, such as days or weeks, and columns for a few discrete periods.
Time runs on the horizontal axis, left to right. Time series charts plot values recorded at regular points, and the line shows the trend. Five relatives cover other time questions:
- Area chart, a line filled to the axis, which Microsoft describes as drawing attention to the total value across a trend.
- Sparkline, a word-sized line with no axes inside a KPI card or table row.
- Slope chart, two points in time joined by lines, for before and after.
- Calendar heat map, one colored cell per day, for weekly patterns.
- Candlestick chart, open, high, low and close per period, for prices.
Label the end of each line instead of using a legend; direct labeling saves the eye a trip to the key. Past about five lines, split the chart into small multiples, a grid of small charts on one shared axis scale, such as small multiples for comparisons across 6 regions, an example rule from our chart selection matrix.
In the TradeZella screens, a candlestick chart sits among the analytics widgets, and Mentor mode lets a coach follow each mentee's cumulative P&L side by side. Count the lines on your busiest trend chart and label each one at its end.
Which types of charts show parts of a whole?
Stacked bars and pie or donut charts are the types of charts that show parts of a whole in a report, with the pie kept to a few parts.
Part-to-whole charts show proportions, so the parts must add up to 100% of one total. As a rule of thumb, keep a pie chart to about 5 slices, because past that readers compare angles they cannot judge. A stacked bar chart works for 2–4 parts when the part that matters sits on the baseline; NN/g counts stacked bars among the charts with the highest error rates, so past 4 parts, or when middle segments must be compared, use grouped bars or small multiples. A 100% stacked bar compares one split across groups, such as plan mix by region. Three more charts fit here:
- Treemap, nested rectangles sized by value, for many parts.
- Waterfall chart, for how a starting value moves to an ending value through gains and losses, such as revenue down to profit.
- Waffle chart, a 10×10 grid of squares, for a share of a count, such as 3 in 10 users.
Count your slices; past five, rebuild the pie as sorted bars.
What are the different types of pie charts?
The different types of pie charts are the standard pie, the donut chart, the exploded pie, pie of pie or bar of pie, and the 3D pie to avoid.
A donut chart is a pie with a hole whose center holds the total; the Mass Media Co. task dashboard we designed uses a task flow donut. An exploded pie pulls one slice out, and Excel's pie of pie and bar of pie move small slices into a second chart. A 3D pie tilts the circle, so front slices look larger than their values. Draw the same data as a flat pie or a donut instead.
Which charts show distribution and relationships?
Histograms and box plots are the chart types for a distribution data question, and scatter plots show whether one variable moves with another.
Use them when the question is "how spread out are the values?" or "does one number rise when another does?"
Distribution charts
Distribution charts show how values spread, so a product report shows the typical case and the outliers instead of one average.
- Histogram: counts the frequency of values in bins, such as sessions by length in 5-minute bins.
- Box plot: shows the median, quartiles and outliers, and compares the spread of many groups side by side.
- Violin plot: a box plot with the full shape of the distribution mirrored around it.
- Strip or dot plot: every value as a dot, for small samples.
What is the difference between a bar chart and a histogram?
A bar chart compares categories, while a histogram shows the frequency of continuous values grouped into bins.
Category bars have gaps and can sit in any order; in a frequency chart the bars touch, because the bins form one continuous axis, and their order is fixed. Reordering those bars would break the scale, which is the quickest test of which chart you are looking at.
Relationship charts
Relationship charts plot two or more variables against each other, so a product team sees whether usage and retention rise together.
- Scatter plot: data points on two numeric axes, showing correlation and the outliers that break it.
- Bubble chart: a scatter plot whose dot area encodes a third variable, read less accurately than position.
- Heat map: a grid of colored cells on two categorical axes; as a correlation matrix, it shows every variable pair at once.
- Connected scatter: dots joined in time order, for two variables over time.
A scatter plot shows correlation, not cause: two numbers can rise together because a third one drives both. Before you average a metric, plot its distribution; a skewed spread changes which number you report.
Which charts show flow, hierarchy and geography?
For flow, hierarchy and geography data questions, use a Sankey diagram, a treemap or sunburst chart, and a choropleth map, chart types the five basics cannot replace.
These specialist charts are harder to read, so use them when the flow, the hierarchy or the place is the point of the question:
- Sankey diagram: band widths show volumes moving between stages, such as traffic source to signup to plan.
- Funnel chart: stage-to-stage drop-off along one path, such as a checkout funnel.
- Network graph: nodes and edges, for connections between people or systems.
- Treemap and sunburst chart: nested rectangles or rings sized by value, for a hierarchy such as budget by department and team.
- Choropleth map: geographic regions shaded by a value; normalize it per capita, or large states look important only because they are large.
- Symbol map: sized circles at locations, for counts by city or store.
Charts like these are where custom data visualization starts: Sankey, network and small-multiple charts are designed and handed to developers as D3.js or Vega-Lite specs, not picked from a menu. In data storytelling, an annotation points readers to the one flow or region that matters. Two charts share the name but answer no data question: a Gantt chart schedules project tasks, and a control chart tracks a process against limits in quality control. Ask whether sorted bars answer the same question; if they do, use them.
Which types of charts fit product dashboards and apps?
In product dashboards and apps, the types of charts that work best are the simple ones (KPI cards with sparklines, bars, lines, bullet charts, tables), read at a glance.
Specialist data visualization charts belong in reports and drill-down views, where readers have time and a wide screen. Four product constraints change the choice:
- Screen width. A phone is far narrower than a desktop chart area, so the chart changes form rather than shrinking, as the image after this list shows.
- Interaction pattern. A filter, or a drill-down from a summary chart to a detail chart, keeps the first view simple, and a tooltip carries exact values.
- Live data. Fix the axis range or animate rescaling, and show when the data last updated.
- One data point. A chart with a single value is a number, so show it as a KPI card.
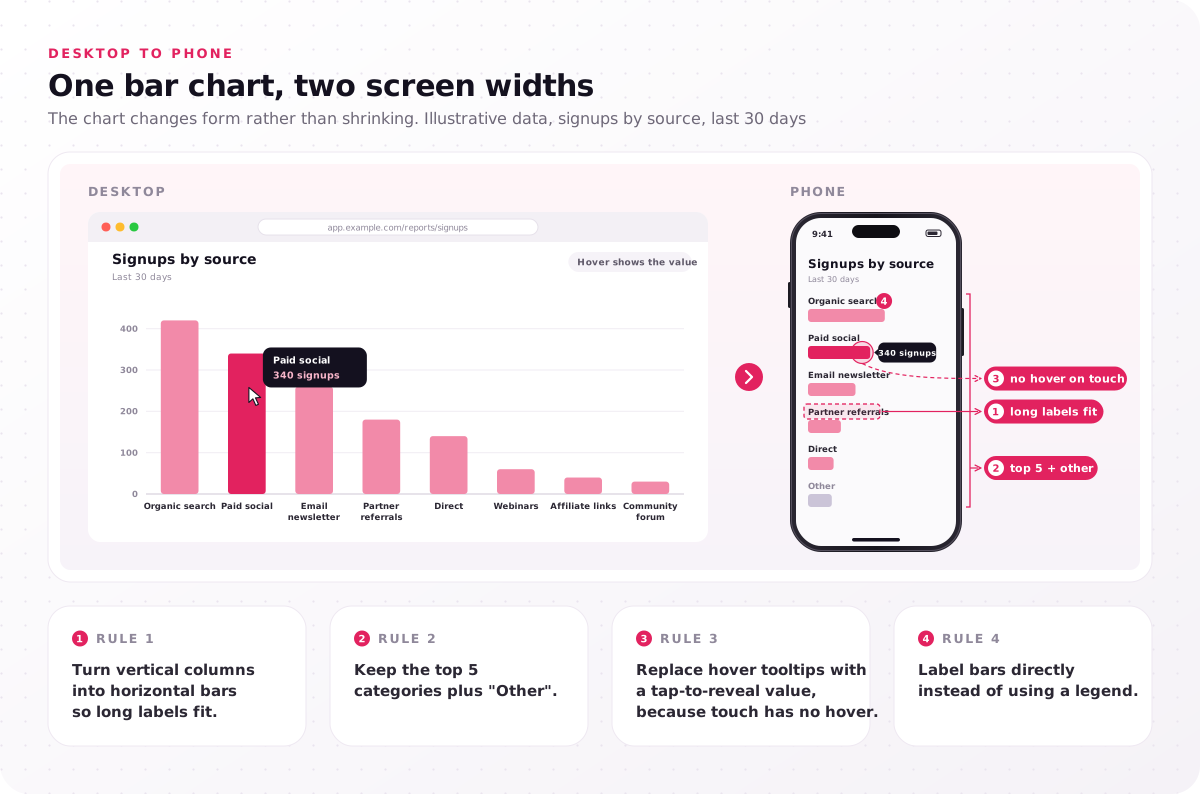
- Turn vertical columns into horizontal bars so long labels fit.
- Keep the top 5 categories plus "Other".
- Replace hover tooltips with a tap-to-reveal value, because touch has no hover.
- Label bars directly instead of using a legend.
Tools name chart types differently: Tableau suggests charts for the selected fields in its Show Me pane, and Power BI lists them in its Visualizations pane. We design charts for Tableau and Power BI as well, with color scales and chart rules applied in each tool's formatting settings.
A gauge chart fits one value against fixed named ranges: the Digno screens we designed show an organization health score of 670.2 on a gauge with score ranges from Poor to Pro, and TradeZella pairs a profit factor gauge with win-rate ring widgets. To compare several values or show progress to a target, use bars or a bullet chart; the Anyday App business dashboard we designed, for example, shows its financial metrics with a transaction details bar chart. When your charts live inside an analytics or admin dashboard, our dashboard design services cover the screen around them. Open your busiest chart on a phone; anything that needs hover to read needs a redesign.
What chart is the most used chart?
No usage census exists, but the bar chart is the best chart for comparisons in the chooser above, and NN/g advises bars, lines or scatter plots in most cases.
The best chart to show anything is the one that answers your data question with position or length: bars for comparisons, lines for trends, scatter plots for relationships. Pick a specialist chart only when none of those three shows the point.
How do you check a chart type before it ships?
Check a chart type before it ships in a product or report with three passes: honest encoding, accessible marks and labels, and a test where users answer 5 questions.
Each pass catches a different failure: a chart that misleads, a chart some users cannot perceive, and a chart that looks right but gets misread.
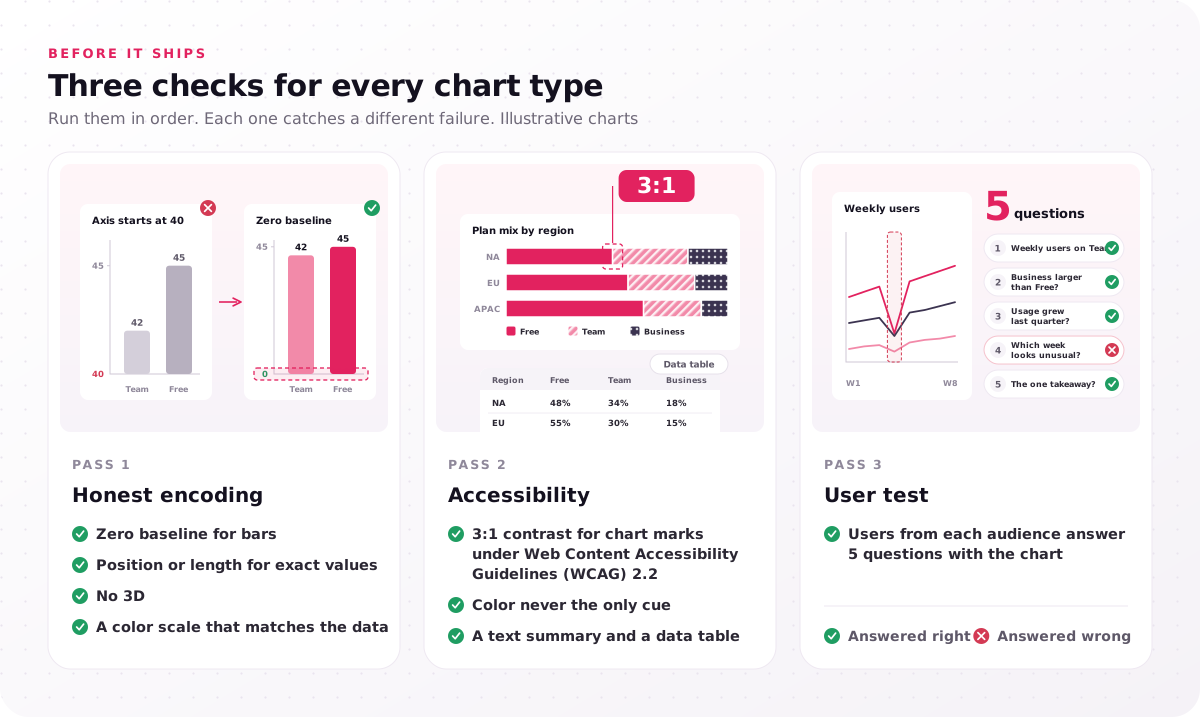
- Honest encoding: zero baseline for bars, position or length for exact values, no 3D, a color scale that matches the data.
- Accessibility: 3:1 contrast for chart marks under Web Content Accessibility Guidelines (WCAG) 2.2, color never the only cue, a text summary and a data table.
- User test: users from each audience answer 5 questions with the chart.
Pass 1, honest encoding. Encoding accuracy is how precisely people read a value from a visual property: position beats length and angle, and both beat area. That ordering comes from Cleveland and McGill's "Graphical Perception" (1984), which the authors offered as a guideline for graph construction, and Jeffrey Heer and Michael Bostock largely reproduced it with crowdsourced participants in 2010. The table pairs common misleading choices with the replacement that fixes each one.
| Misleading choice | Replacement |
|---|---|
| 3D pie | Flat pie with few slices, or sorted bars |
| Truncated bar axis | Zero baseline, or a dot plot |
| Dual-axis line chart | Two aligned charts sharing the time axis |
| Rainbow color scale on ordered values | Sequential color scale, such as ColorBrewer's |
| Pie with many slices | Sorted bars |
Pass 2, chart accessibility. Under the WCAG 2.2 Non-text Contrast criterion, graphical objects needed to understand the content, which covers chart marks such as lines, bars and slices, need a contrast ratio of at least 3:1 against adjacent colors. The Use of Color criterion rules out color as the only cue, so label lines directly, add patterns to stacked segments, and pair red and green status with icons. Every chart needs a text alternative: a one-sentence takeaway plus a data table for screen reader users. Match the color scale to the data: categorical for groups, sequential for ordered values, diverging around a midpoint such as zero change.
Pass 3, the 5-question test. In our data visualization process, users from each audience answer 5 questions with the charts, and designers check every chart against WCAG 2.2. For the intro's made-up plan data, ask how many weekly users Team has, whether Business is larger than Free, whether usage grew last quarter, which week looks unusual, and what the one takeaway is. Run the 5-question test on your most-used chart this week; one wrong answer tells you more than a design review.
When is a chart selection matrix worth building?
A chart selection matrix is worth building when several people publish charts, users misread the current types of charts, or a customer dashboard or annual report is planned.
Our data visualization work delivers a chart selection matrix beside a data audit, a visualization style guide, interactive chart prototypes, a chart accessibility spec and a developer handoff; it is a set of rules that match each data question to a chart type. Five signals call for one:
- Teams publish charts in different styles, because each report then teaches readers a new color code.
- Support tickets or user tests show misread charts, because the encoding does not match the data type.
- Customers see charts inside your product, because a branded, interactive chart becomes part of the product experience.
- A contract names WCAG 2.2, because accessibility then needs written rules per chart type.
- An annual report needs more than standard bars, because flows, hierarchies and maps need custom chart design.
The color scale and the accessibility rule for each question live beside the chart selection matrix, in the visualization style guide and the chart accessibility spec. More charts and deeper interactivity raise the price, and how chart count and interactivity set the price gives the ranges.
The question column is the part only your team can fill. A list of 3–10 questions, each marked with the types of charts in this guide that answer it, already works as a brief, and you can send us the questions your users ask of your data as they stand. Every project begins with a free consultation and a fixed-scope proposal.
FAQs
What types of charts does Excel offer?
Microsoft Excel offers more than a dozen chart families: column, line, pie and doughnut, bar, area, XY (scatter) and bubble, stock, surface and radar, plus newer families such as treemap, sunburst, histogram, box and whisker, waterfall and funnel, along with combo and map charts. Each family has variants, such as stacked and 100% stacked columns, so counts of Excel chart types differ from list to list; for a four-chart shortlist, start with column, line, pie and bar.
Which chart is best for comparing two things?
A bar chart with the two bars side by side from a zero baseline is best for two values. For two values over time, use a two-line chart with direct labels, and for before and after across many items, use a slope chart or a dumbbell chart, two dots joined by a line.
Are pie charts bad?
No. A pie chart works for a few parts of one whole when the message is "this part is about half". It fails with many slices, with slices of similar size, or when two pies must be compared, because angle and area are read less accurately than position, as the perception studies in the three-pass check found.
What is the best chart for showing percentages?
For one percentage against a target, a bullet chart or a single large number with a bar works best. For a few parts of one whole, use a pie or donut chart, and to compare the same split across groups, use 100% stacked bars.
Can one dataset need more than one chart type?
Yes. Each data question needs its own chart: the made-up plan data in the intro needs a line chart for growth, a sorted bar chart for the largest plan and a stacked bar for each plan's share. That is why a chart selection matrix starts from the questions each audience asks of the data, not from the dataset.