Key takeaways
- Design system ROI is (gain − cost) ÷ cost, where gain is UI hours saved × loaded hourly cost and cost is build plus upkeep, over 3–5 years.
- Measure a baseline in 2–4 weeks before the build: time per screen, duplicate components from a UI inventory and UI bug tickets.
- Model time saved as a low, expected and high range; Sparkbox's one test of IBM Carbon (8 developers, one form) is an upper bound, not a benchmark.
- Upkeep decides payback: in our illustrative 3-team model, the 10% scenario does not break even within 5 years.
- A full design system fits when 2 or more teams build on the same product; 1 product with 1–2 designers needs a UI kit and tokens first.
How do you prove design system ROI before anyone signs a $60,000 purchase order? Treat it as plain return on investment (ROI): count the user interface (UI) hours your teams spend today, price them at fully loaded labor cost, model a low, expected and high share of time saved, and subtract what the system costs to build and keep alive. The output is a payback month and a range that fits on one page for finance. Below is a step-by-step way to calculate design system ROI, with the build priced against the published fee for our design system services, plus the cases where the honest answer is "not yet".
What does design system ROI actually measure?
Design system ROI compares the hours a shared library saves your designers and engineers with what the system costs to build and keep alive, over a set horizon.
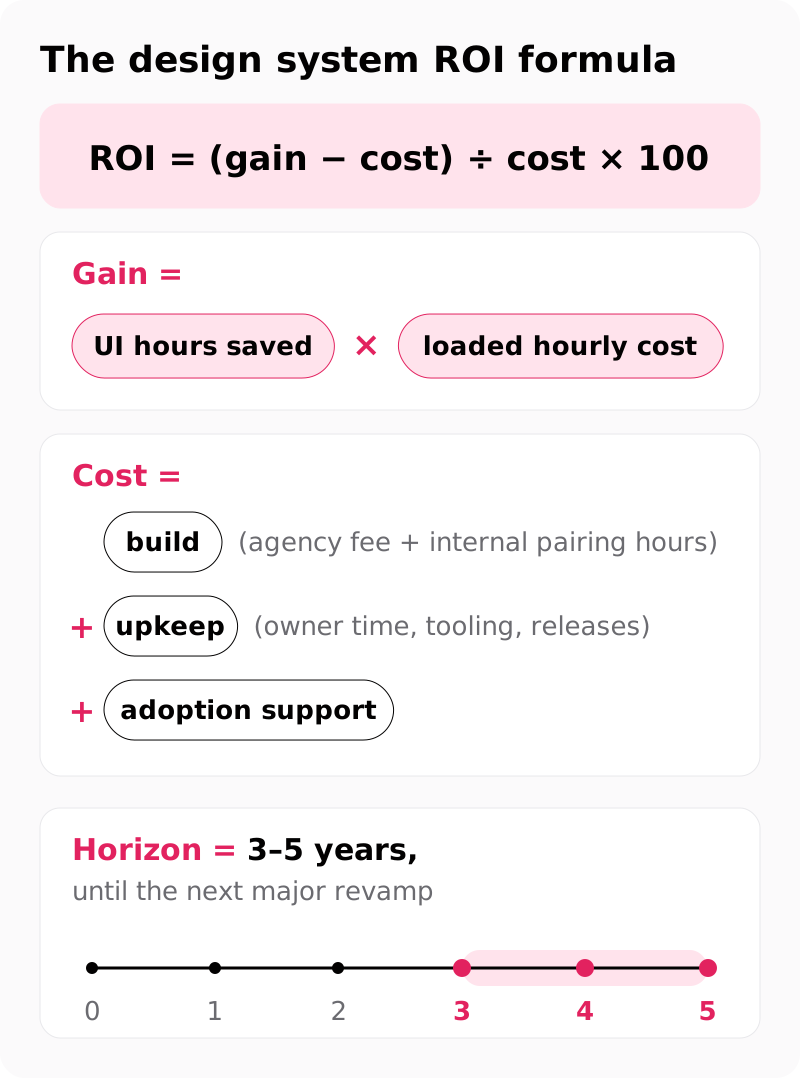
The arithmetic behind design system ROI is the standard one: ROI = (gain − cost) ÷ cost × 100. Gain is hours saved on UI design, front-end build, UI quality assurance (QA) and rework, multiplied by loaded hourly cost. Cost is the build and maintenance cost plus adoption support.
For the horizon, Maximilian Speicher and Guido Baena Wehrmann's ROI formula in Smashing Magazine (2022) models a design system over 5 years, starting with a productivity dip while the team builds and reaching savings only after a break-even point. Use 5 years when the roadmap is stable and 3 years when a replatform or rebrand is likely sooner.
Show as text
- Gain = UI hours saved × loaded hourly cost
- Cost = build (agency fee + internal pairing hours) + upkeep (owner time, tooling, releases) + adoption support
- ROI = (gain − cost) ÷ cost × 100
- Horizon = 3–5 years, until the next major revamp
Report three effects next to the dollar figure, not inside it:
- Brand consistency and cheaper rebrands, because shared design tokens hold the same color and type values in every product, so a later rebrand changes the tokens instead of every screen.
- Accessibility risk avoided, because a component that meets Web Content Accessibility Guidelines (WCAG) 2.2 contrast and focus rules fixes an issue once, not per screen.
- Onboarding speed, because a new hire learns one component library instead of three teams' habits.
Next, collect the five numbers the formula needs.
Which 5 inputs does the calculation need?
You need 5 inputs: baseline UI hours, loaded hourly cost, expected share of time saved, build cost and annual upkeep.
Loaded hourly cost is where most ROI models go soft, so anchor it to public data. The U.S. Bureau of Labor Statistics (BLS) lists May 2025 median pay for computer occupations of $134,040 for software developers, quality assurance analysts and testers, and $99,520 for web developers and digital designers. Its Employer Costs for Employee Compensation release for June 2026 puts wages and salaries at 70.0% of private-industry employer costs and benefits at 30.0%. Divide hourly pay (at 2,080 hours a year) by 0.70 for roughly $92 an hour per engineer and $68 per designer, or use your payroll figures.
Time saved moves design system ROI more than any other input, so give it a range. One public timing test with a stated method comes from Sparkbox: 8 of its developers built the same form page from scratch (median 4.2 hours) and with IBM's Carbon Design System (median 2 hours), learning time included. It is a small sample on one form with a mature system, and everyone built from scratch first, so treat it as an upper bound for early months.
Build cost is the agency fee plus your engineers' pairing hours on coded components; take the fee from our published design system price range and list internal hours on their own line. For design system maintenance cost, skip rule-of-thumb percentages: name the owners, estimate the share of their month, and add tooling licenses.
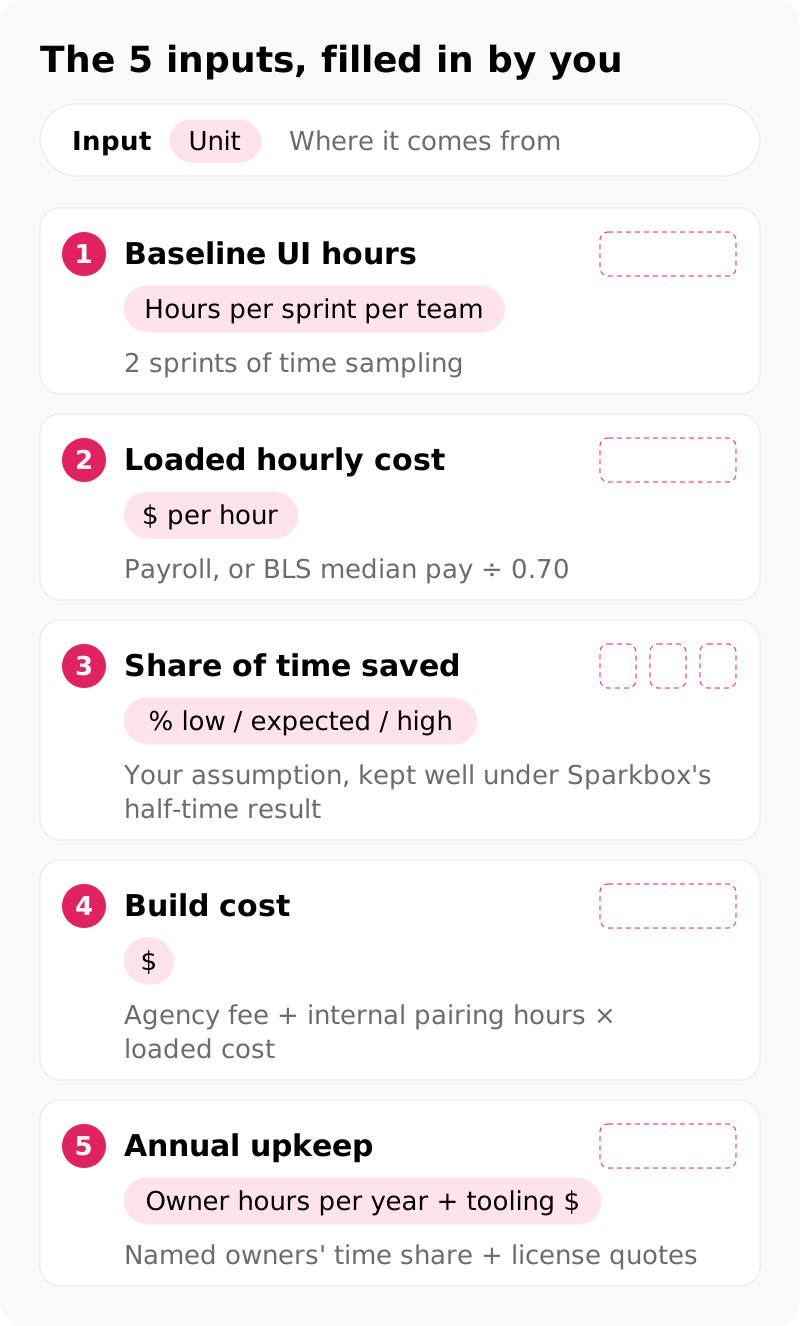
Show as text
| Input | Unit | Where it comes from |
|---|---|---|
| Baseline UI hours | Hours per sprint per team | 2 sprints of time sampling |
| Loaded hourly cost | $ per hour | Payroll, or BLS median pay ÷ 0.70 |
| Share of time saved | % low / expected / high | Your assumption, kept well under Sparkbox's half-time result |
| Build cost | $ | Agency fee + internal pairing hours × loaded cost |
| Annual upkeep | Owner hours per year + tooling $ | Named owners' time share + license quotes |
The first input comes from your own sprints, so measure it next.
How do you measure a baseline before the build?
Measure a baseline in 2–4 weeks with 3 cheap signals: time per screen, duplicate components and UI bug tickets.
Each signal feeds your model with a different number: hours, duplication and rework. Run them in parallel:
- Time sampling. Ask 3–5 designers and engineers to tag hours on new screens, UI fixes and rework for 2 sprints, logged during the sprint because remembered hours drift.
- Duplicate count. Screenshot every screen and group the parts by component: button styles, color values, spacing values. Eleven button variants where three would do is a number a chief financial officer (CFO) understands.
- UI bug tickets. Label last quarter's tickets in Jira or Linear as UI inconsistency or repeated fix, and count them per month.
The duplicate count is the UI inventory that opens a design system engagement with us, so a team that buys the build gets its duplicate count as a by-product. For a rough estimate before any purchase, run signals 1 and 3 yourself: they need a spreadsheet, not a consultant.
Worked example: payback for a 3-team product
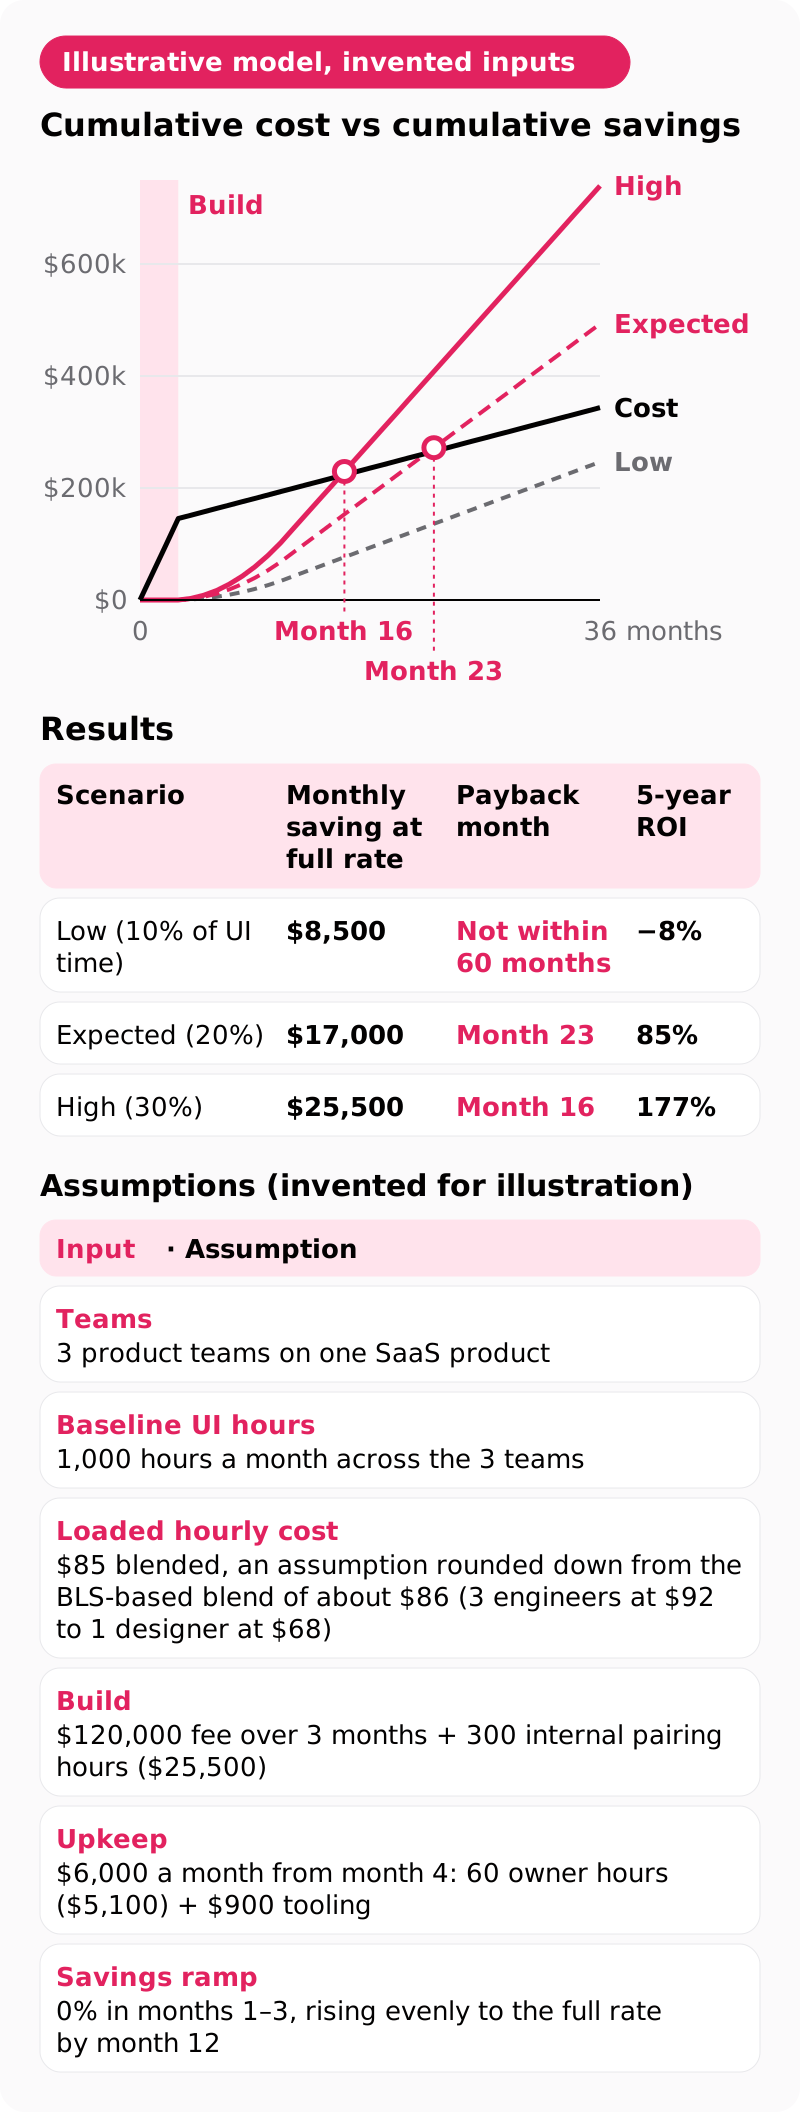
In this illustrative model, a 3-team product pays back its $145,500 build plus upkeep in month 23 (expected) or month 16 (high), and not within 5 years (low).
Every input here is invented to show the mechanics; it is a model, not a client result. Picture a software as a service (SaaS) product built by 3 teams, the kind of setup our SaaS UI UX design page describes, with a 12-week build at $120,000, picked from inside the published range. Savings start at zero and reach the full rate by month 12, because adoption is gradual.
Show as text
Assumptions (invented for illustration)
| Input | Assumption |
|---|---|
| Teams | 3 product teams on one SaaS product |
| Baseline UI hours | 1,000 hours a month across the 3 teams |
| Loaded hourly cost | $85 blended, an assumption rounded down from the BLS-based blend of about $86 (3 engineers at $92 to 1 designer at $68) |
| Build | $120,000 fee over 3 months + 300 internal pairing hours ($25,500) |
| Upkeep | $6,000 a month from month 4: 60 owner hours ($5,100) + $900 tooling |
| Savings ramp | 0% in months 1–3, rising evenly to the full rate by month 12 |
Results
| Scenario | Monthly saving at full rate | Payback month | 5-year ROI |
|---|---|---|---|
| Low (10% of UI time) | $8,500 | Not within 60 months | −8% |
| Expected (20%) | $17,000 | Month 23 | 85% |
| High (30%) | $25,500 | Month 16 | 177% |
The design system payback period is the number of months until cumulative savings cross cumulative cost, the break-even point on the chart. The low scenario shows that upkeep, not the build price, decides the case: at 10%, the system nets $2,500 a month once adopted and never recovers its $145,500 build inside 5 years. Halve the owner hours and the same scenario breaks even in month 39. Adoption speed is the other lever: as an illustrative sensitivity check, a ramp that reaches full rate in month 24 instead of month 12 moves expected payback from month 23 to month 32.
Copy the assumptions into a spreadsheet, replace each row with your baseline, and keep all three scenarios.
Which costs do most ROI models leave out?
Most design system ROI models leave out 5 costs: upkeep, migration of existing screens, adoption support, tooling and the slowdown while your engineers help build the library.
Count only the build fee and payback looks months earlier than it is, a gap finance spots in the first review.
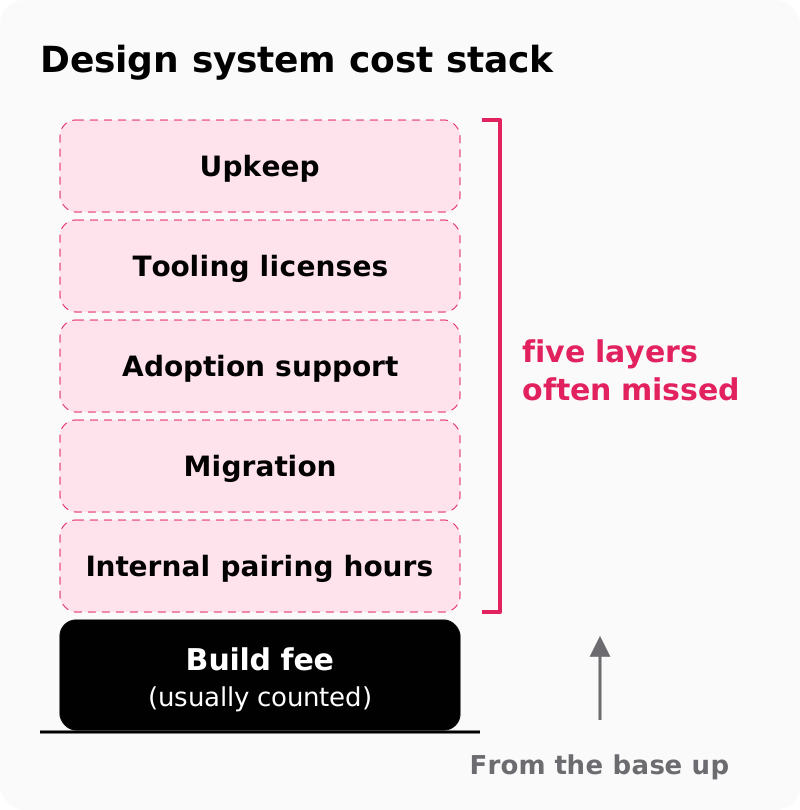
Show as text
From the base up: build fee (usually counted), then five layers often missed: internal pairing hours, migration, adoption support, tooling licenses and upkeep.
How to price each missed layer:
- Build slowdown. The Smashing Magazine model starts with a productivity dip before break-even, so count engineers' pairing hours as cost.
- Migration. On an existing product, the system replaces duplicate patterns screen by screen, without a full redesign; estimate engineering hours per screen.
- Adoption support. Our process closes with 2 rollout workshops; budget office hours and contribution reviews for two more quarters.
- Tooling. Figma Organization or Enterprise seats for library analytics, Zeroheight, Chromatic; take current quotes from vendor pricing pages.
- Upkeep. Name an in-house owner, or book an embedded design team for upkeep, which we price at $15,000–$40,000 per month.
The worked example above folds adoption support into its 60 owner hours and has no migration row. Add 400 engineering hours of migration ($34,000) across months 4–9 and the same illustrative model's expected case pays back in month 26 instead of 23.
Give each layer its own row in your ROI sheet so a reviewer can change one without rebuilding the rest.
When does a design system never pay back?
A design system does not pay back when 1 small team builds 1 stable product and the upkeep outruns the hours saved.
Team count draws the line: a full design system fits when 2 or more teams build on the same product, and below that, a UI kit plus design tokens covers the need. Three more cases push design system ROI below zero:
- A product being sunset, because savings stop before the build is recovered.
- A rebrand planned with no time to tokenize, because components built on hard-coded values get rebuilt within months.
- No engineer willing to own the coded library, because a Figma-only system saves design time but little build time, where most UI hours sit.
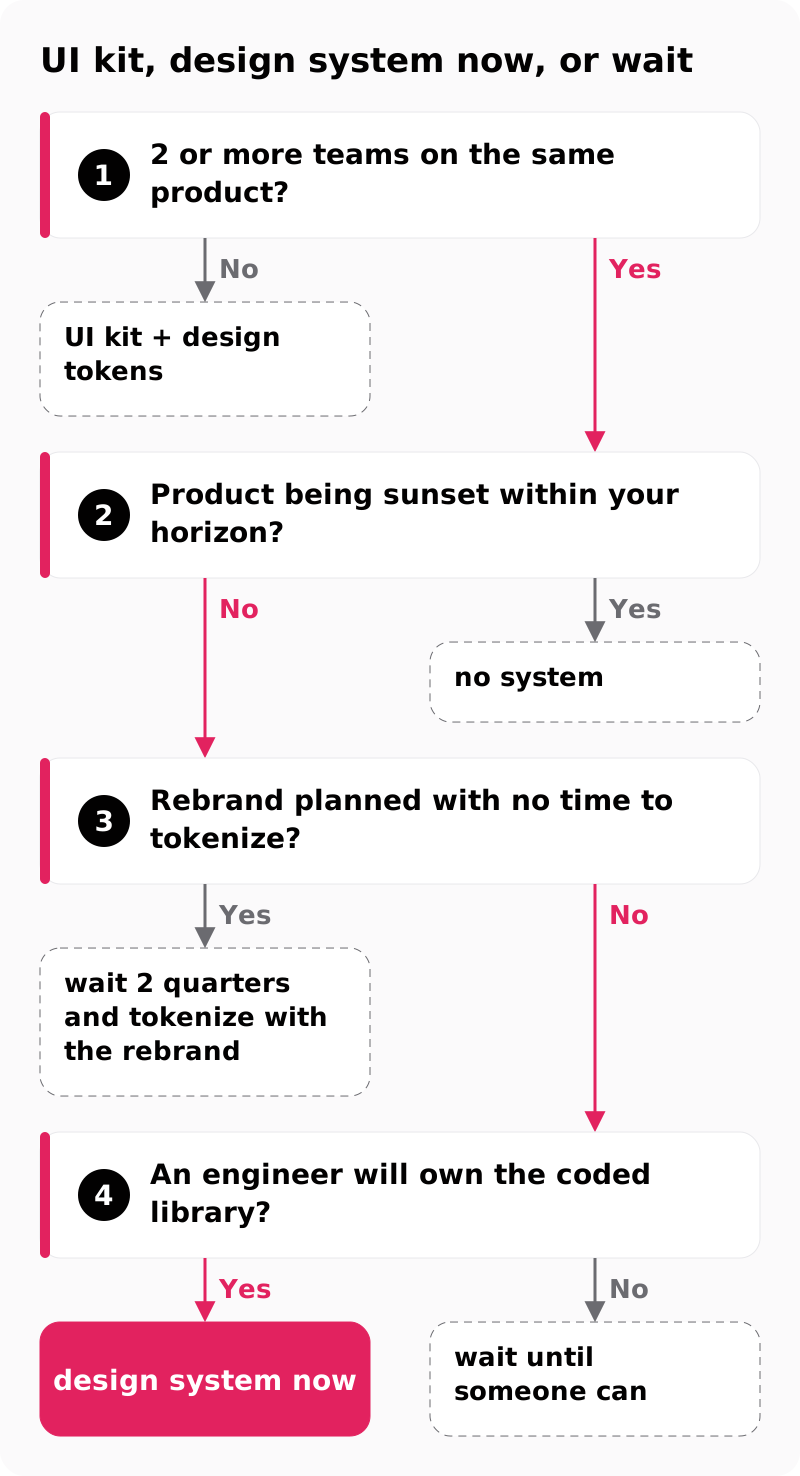
Show as text
- 2 or more teams on the same product? No → UI kit + design tokens. Yes → 2.
- Product being sunset within your horizon? Yes → no system. No → 3.
- Rebrand planned with no time to tokenize? Yes → wait 2 quarters and tokenize with the rebrand. No → 4.
- An engineer will own the coded library? No → wait until someone can. Yes → design system now.
Run the model when the tree ends at "design system now", and treat each extra signal as a reason to use the expected scenario rather than the low one: a second product or platform coming, one component in several versions, repeated accessibility fixes.
How do you turn the numbers into a one-page business case?
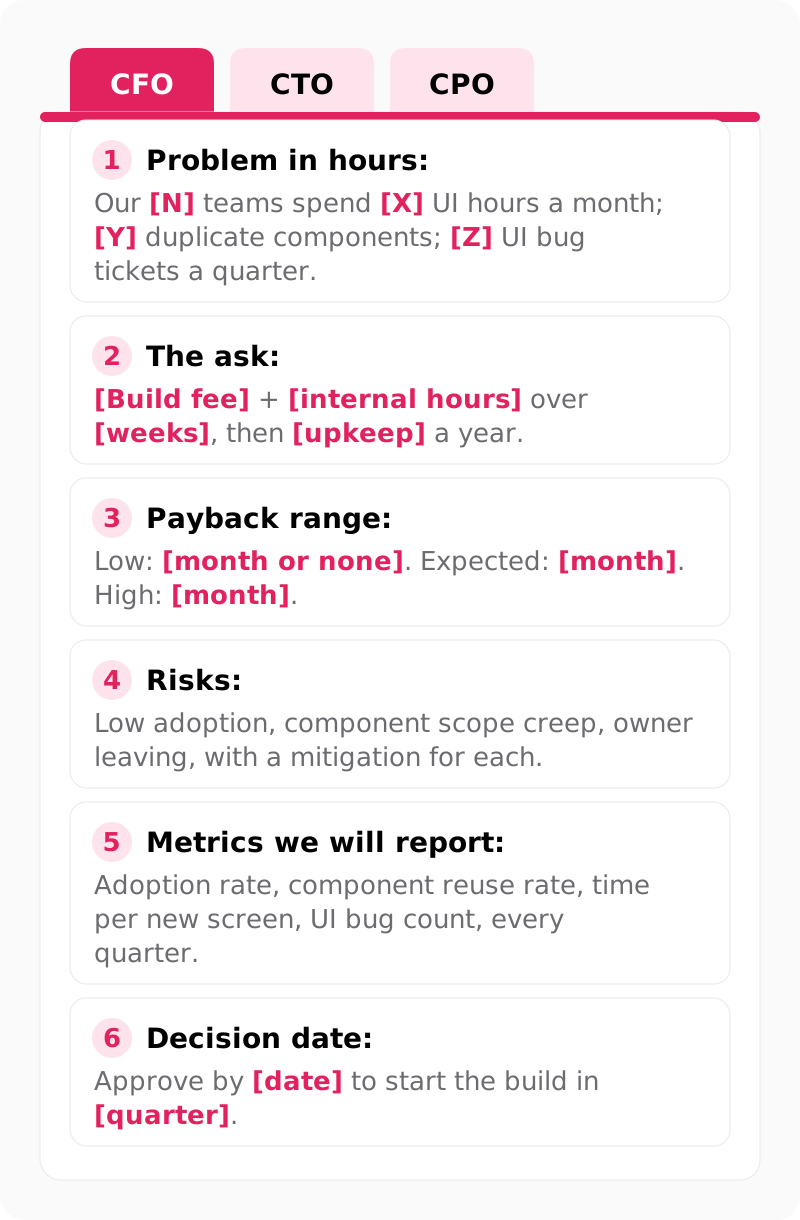
A one-page business case has 6 blocks: the problem in hours, the ask, the payback range, the risks, the metrics you will report and the decision date.
A design system business case moves faster with one headline per approver. The CFO wants the payback month and cash out by quarter; the chief technology officer (CTO) or vice president (VP) of engineering wants front-end hours and UI bug counts; the chief product officer (CPO) wants shipping speed and cross-product consistency.
Put the low scenario first, because finance trusts the conservative number. Drop any headline figure of the "5–10x return" or "pays back in a few months" kind that arrives without a published method, sample size and team size, because finance will ask for all three. Name 3 risks with a mitigation each: low adoption (targets per team), component scope creep (a fixed v1 list) and the owner leaving (two named owners).
Show as text
- Problem in hours: "Our [N] teams spend [X] UI hours a month; [Y] duplicate components; [Z] UI bug tickets a quarter."
- The ask: "[Build fee] + [internal hours] over [weeks], then [upkeep] a year."
- Payback range: "Low: [month or none]. Expected: [month]. High: [month]."
- Risks: "Low adoption, component scope creep, owner leaving, with a mitigation for each."
- Metrics we will report: "Adoption rate, component reuse rate, time per new screen, UI bug count, every quarter."
- Decision date: "Approve by [date] to start the build in [quarter]."
Paste the text version into your own document and fill the brackets from your model.
Which metrics prove the ROI after launch?
Four metrics prove design system ROI after launch: adoption rate, component reuse rate, time per new screen and UI bug count.
To measure design system adoption in design files, use Figma library analytics, available on the Organization and Enterprise plans; it counts inserts per team and detaches per component, with up to a year of history.
| Metric | Instrument | When to check |
|---|---|---|
| Adoption rate | Figma library analytics: inserts per team, detaches per component | Monthly |
| Component reuse rate | Share of front-end screens importing library components; Storybook stories per component | Quarterly |
| Time per new screen | Re-run the 2-sprint time sample | Months 3, 6 and 12 |
| UI bug count | The same Jira or Linear label as the baseline | Quarterly |
Storybook is the catalogue of coded components, so the share of library components with a story is the coded-coverage figure to report. Zeroheight is the documentation site where teams look up usage rules. Chromatic visual tests compare each Storybook story with its last approved snapshot and flag any visual change for review.
Design system governance turns these numbers into decisions. Our engagement hands over a governance model (who proposes, reviews and releases changes), 2 training workshops for product teams and version 1.0. From then on, the two named owners from your business case present the quarterly report, a monthly contribution review accepts or rejects new components, and a component with a high detach rate gets fixed or deprecated in the next release.
What should you bring to a design system scoping call?
Bring 4 facts to a scoping call: products and platforms in scope, number of brands or themes, your front-end stack and your baseline hours.
Our published design system price range of $60,000–$180,000 over 8–16 weeks depends on scope, including platforms and the number of brands or themes. When the fixed-scope proposal arrives, put its price in the build row, re-run the three scenarios, and your design system ROI carries a real cost line instead of a placeholder.
Your sprints, payroll and tickets fill most of the sheet, and vendor pricing pages fill the tooling line, but the agency fee in the build row has to come from a proposal. When you are ready for it, bring your baseline sheet to us: every project begins with a free consultation and a fixed-scope proposal.
FAQs
Is a design system worth it for a small team?
No, not for 1 product with 1–2 designers. Start with a UI kit and design tokens; a full design system fits when 2 or more teams build on the same product.
How long does a design system take to pay back?
Payback depends on team size, upkeep and adoption speed, so no single figure holds. The build alone takes 8–16 weeks before savings start; run the three-scenario model above instead of trusting a generic claim.
Can you estimate design system ROI without a baseline?
Yes, roughly: reconstruct UI hours from past tickets and pull-request history, and count duplicates from screenshots. Label it as an estimate, and start real time sampling before the build so the first quarterly report compares like with like.
Does a design system increase revenue?
No, not directly. A design system saves time and cuts UI defects; revenue effects arrive through faster releases, so report them next to design system ROI, not inside it, where finance would dispute the attribution.
Should accessibility count in design system ROI?
Yes, as risk avoided rather than as gain. Components that hold WCAG 2.2 contrast and focus rules stop the same fix from repeating on every screen, so report fewer accessibility tickets per quarter instead of an invented dollar figure.